Explore Platform Cloud
This demo tutorial provides an introduction to Seqera Platform, including instructions to:
- Launch, monitor, and optimize the nf-core/rnaseq pipeline
- Select pipeline input data with Data Explorer and Platform datasets
- Perform tertiary analysis of pipeline results with Data Studios
The Platform Community Showcase is a Seqera-managed demonstration workspace with all the resources needed to follow along with this tutorial. All Seqera Cloud users have access to this example workspace by default.
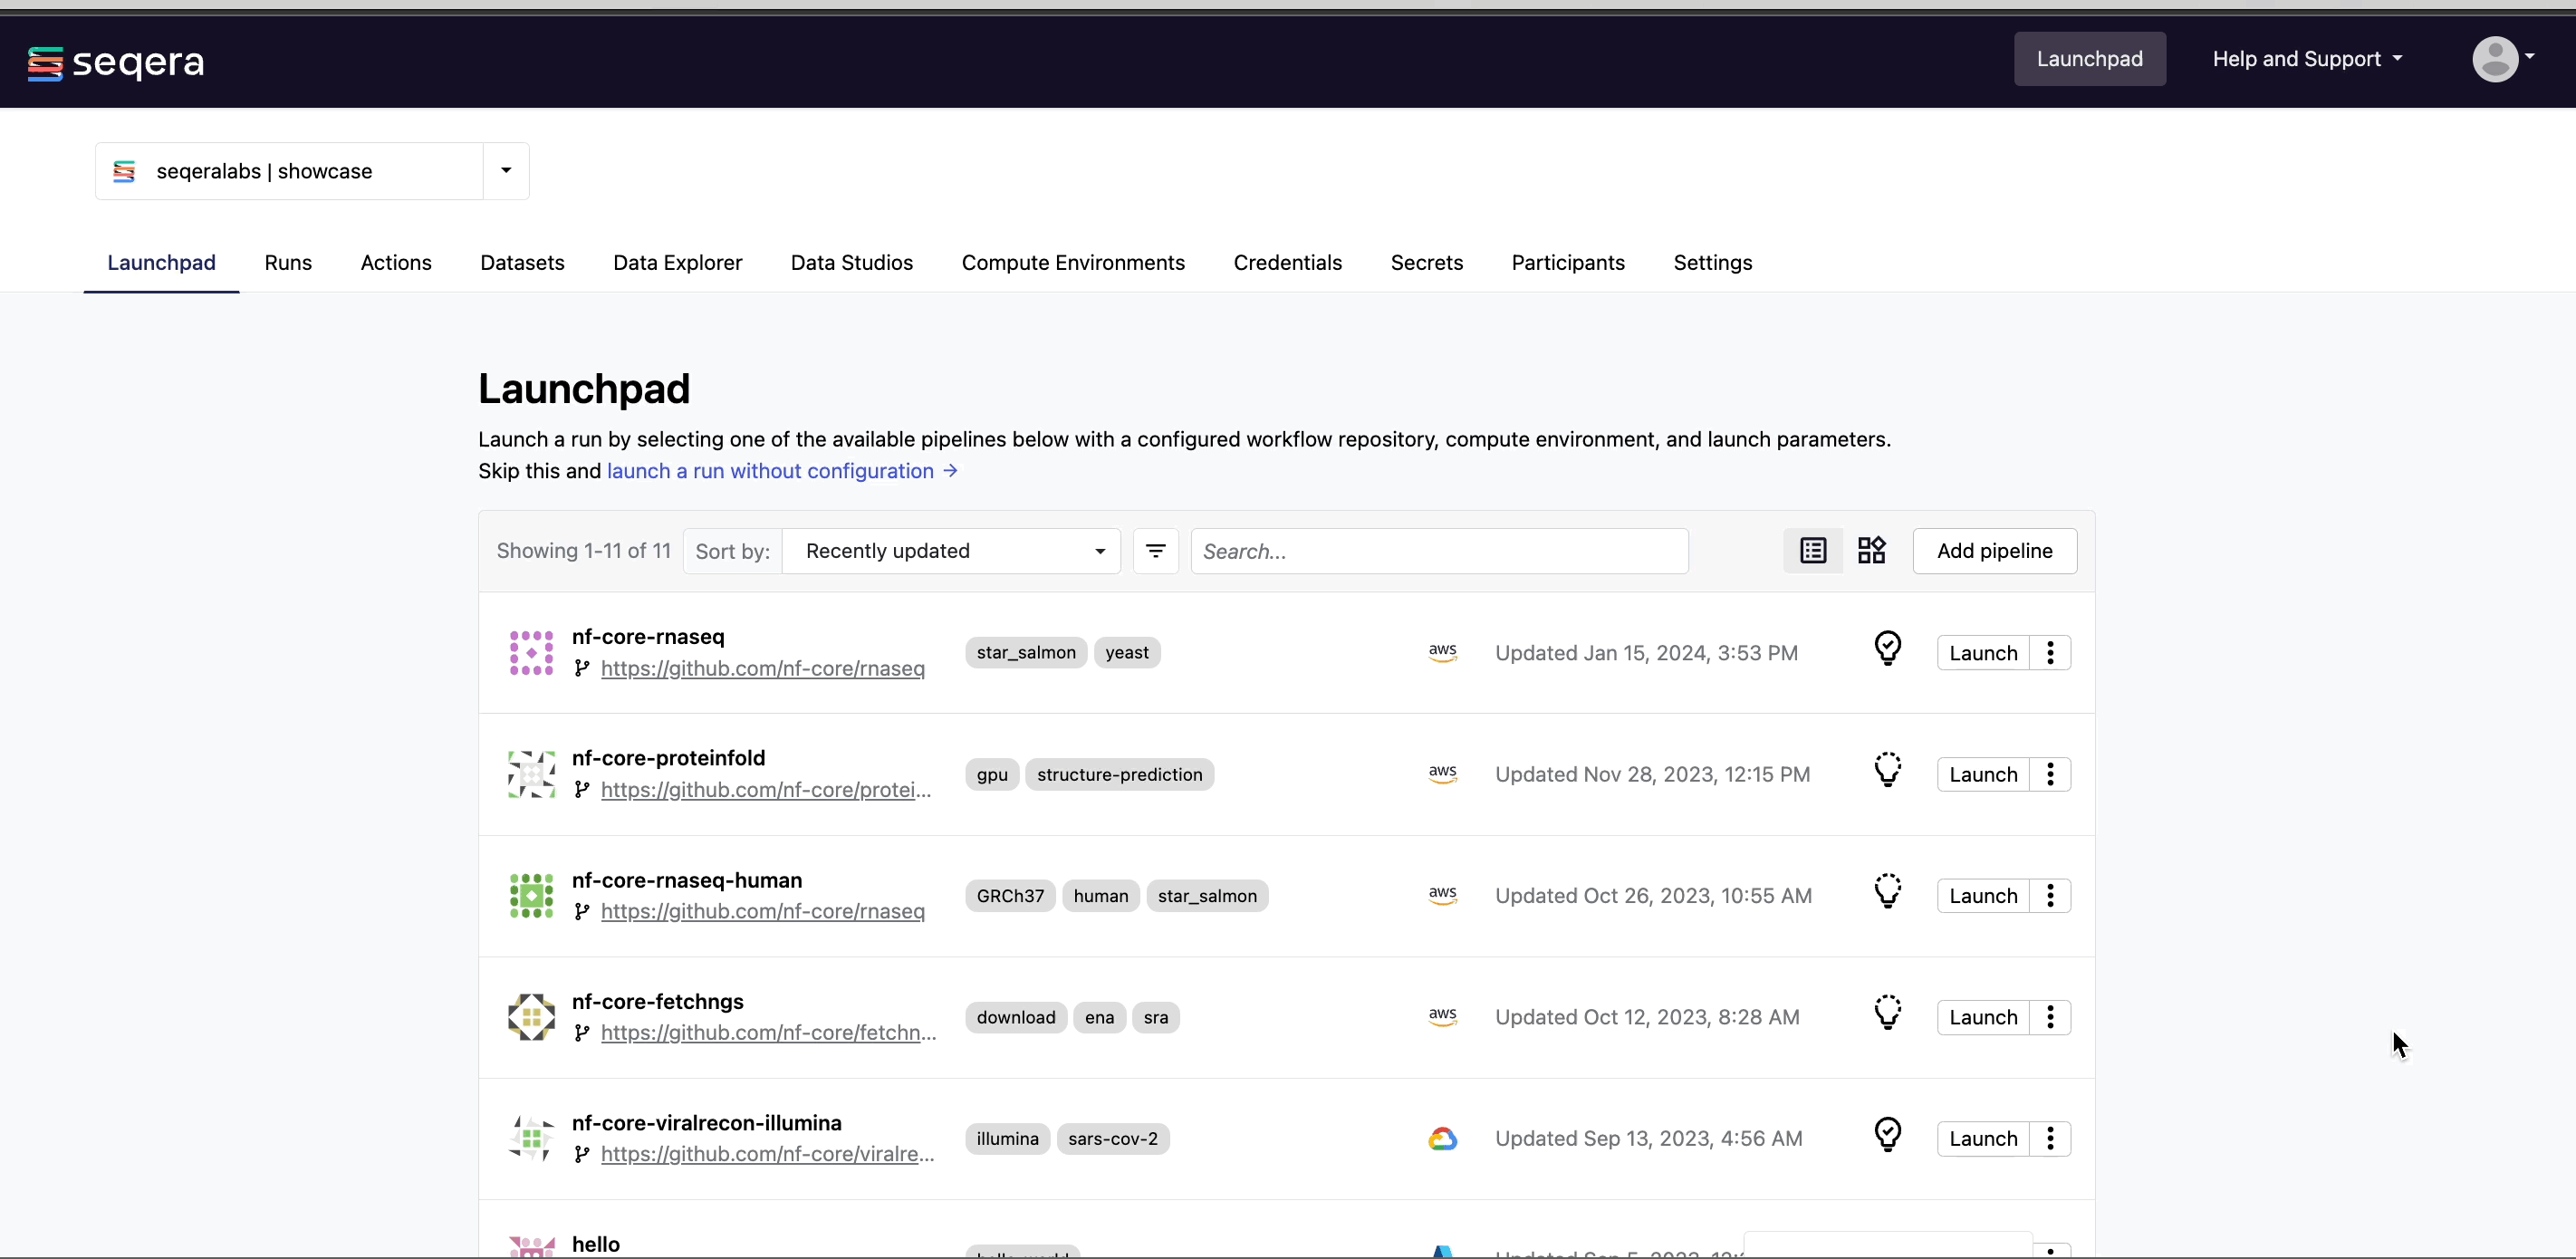
The Launchpad in every Platform workspace allows users to easily create and share Nextflow pipelines that can be executed on any supported infrastructure, including all public clouds and most HPC schedulers. A Launchpad pipeline consists of a pre-configured workflow repository, compute environment, and launch parameters.
The Community Showcase contains 15 preconfigured pipelines, including nf-core/rnaseq, a bioinformatics pipeline used to analyze RNA sequencing data.
The workspace also includes three preconfigured AWS Batch compute environments to run Showcase pipelines, and various Platform datasets and public data sources (accessed via Data Explorer) to use as pipeline input.
To skip this Community Showcase demo and start running pipelines on your own infrastructure:
- Set up an organization workspace.
- Create a workspace compute environment for your cloud or HPC compute infrastructure.
- Add pipelines to your workspace.
Launch the nf-core/rnaseq pipeline
This guide is based on version 3.14.0 of the nf-core/rnaseq pipeline. Launch form parameters may differ in other versions.
Navigate to the Launchpad in the community/showcase workspace and select Launch next to the nf-core-rnaseq pipeline to open the launch form.
Nextflow parameter schema
The launch form lets you configure the pipeline execution. The pipeline parameters in this form are rendered from a pipeline schema file in the root of the pipeline Git repository. nextflow_schema.json is a simple JSON-based schema describing pipeline parameters for pipeline developers to easily adapt their in-house Nextflow pipelines to be executed in Platform.
See Best Practices for Deploying Pipelines with the Seqera Platform to learn how to build the parameter schema for any Nextflow pipeline automatically with tooling maintained by the nf-core community.
Parameter selection
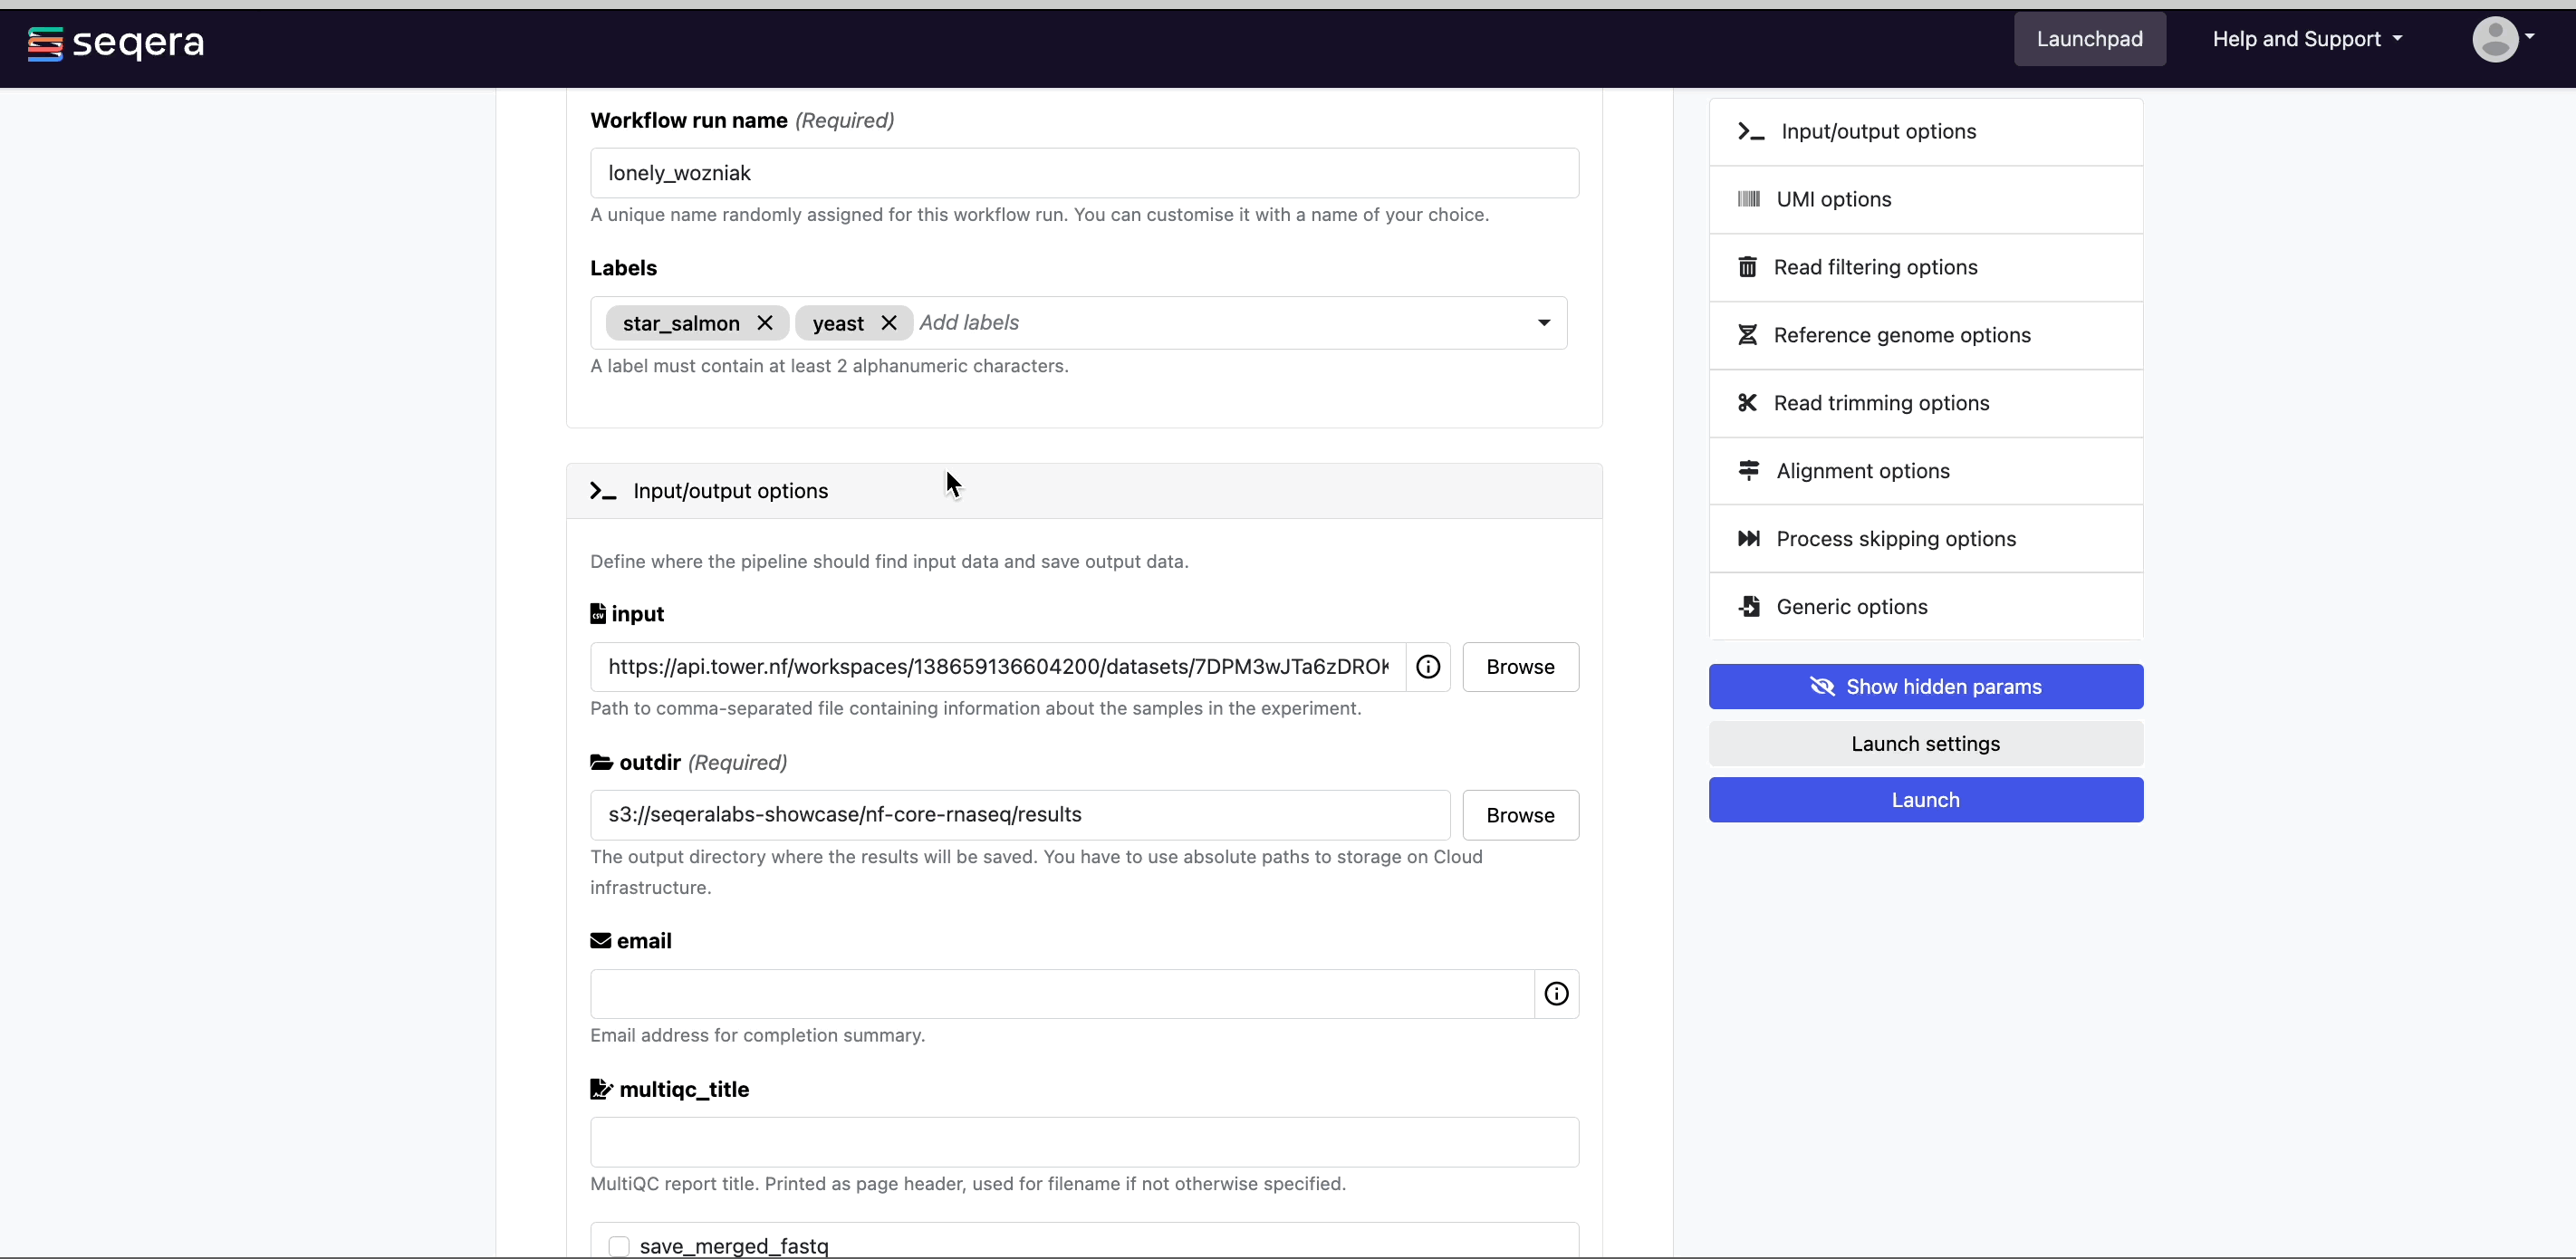
Adjust the following Platform-specific options:
- Workflow run name: A unique identifier for the run, pre-filled with a random name. This can be customized.
- Labels: Assign new or existing labels to the run. For example, a project ID or genome version.
nf-core/rnaseq requires a set of parameters to run:
input
Most nf-core pipelines use the input parameter in a standardized way to specify an input samplesheet that contains paths to input files (such as FASTQ files) and any additional metadata needed to run the pipeline. Use Browse to select either a file path in cloud storage via Data Explorer, or a pre-loaded Dataset:
Data Explorer
In the Data Explorer tab, select the nf-tower-data bucket, then search for and select the rnaseq_sample_data.csv file.
Datasets
In the Datasets tab, search for and select rnaseq_sample_data.
- See Add data to learn how to add datasets and Data Explorer cloud buckets to your own workspaces.
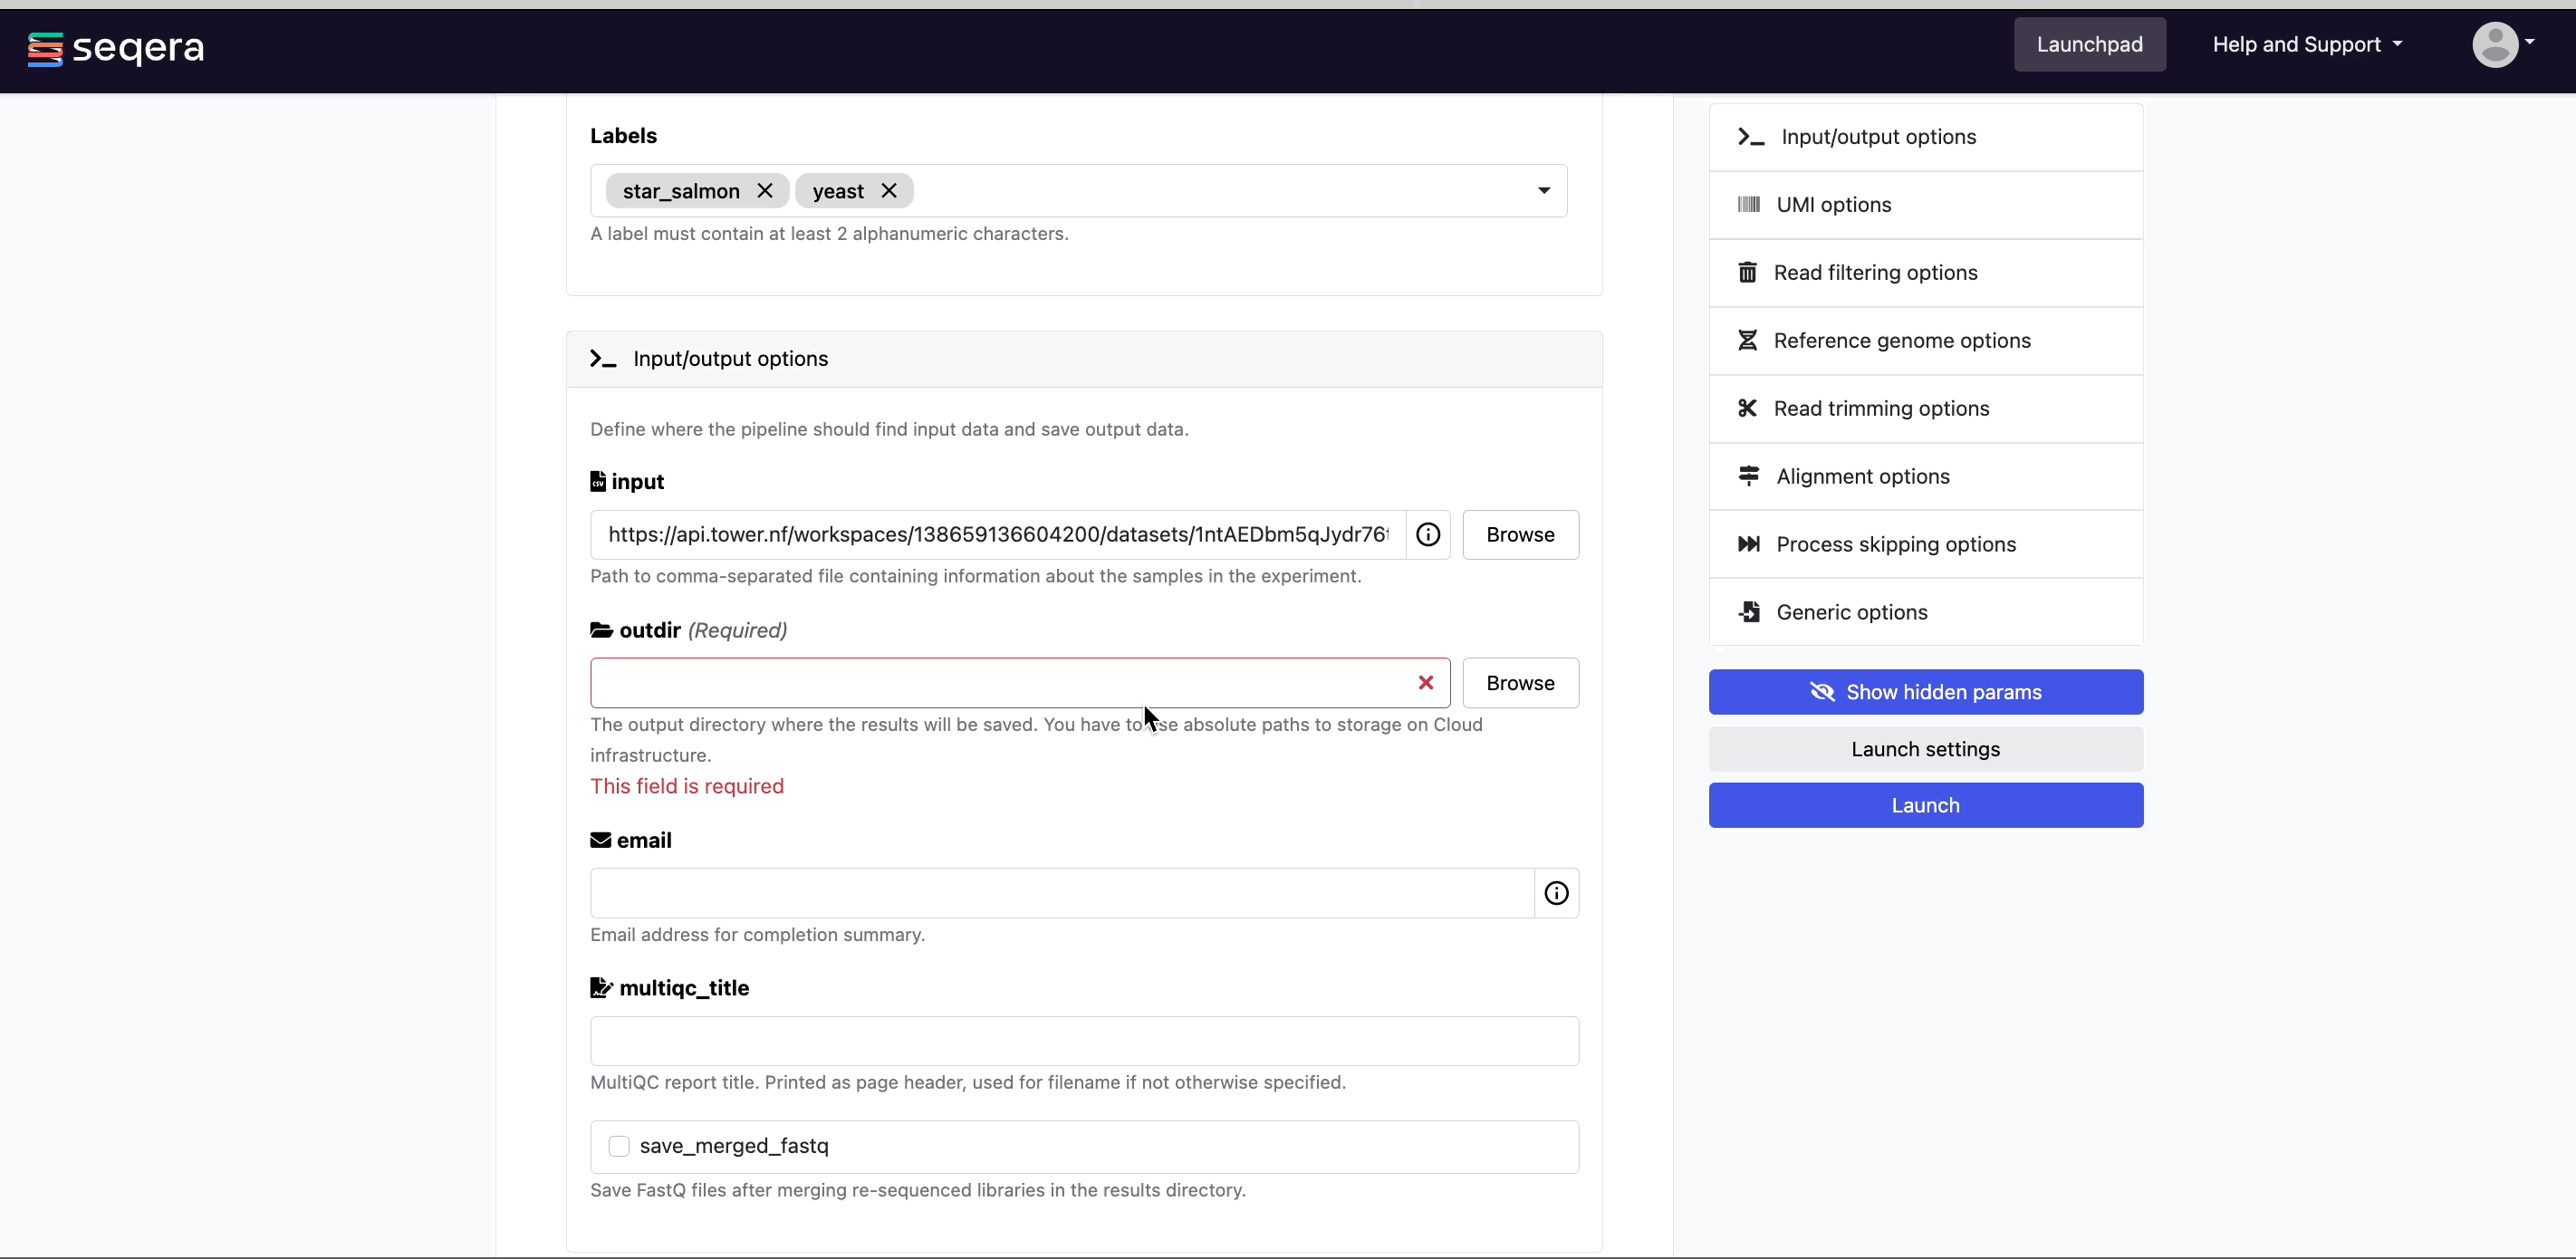
output
Most nf-core pipelines use the outdir parameter in a standardized way to specify where the final results created by the pipeline are published. outdir must be unique for each pipeline run. Otherwise, your results will be overwritten.
For this tutorial test run, keep the default outdir value (./results).
For the outdir parameter in pipeline runs in your own workspace, select Browse to specify a cloud storage directory using Data Explorer, or enter a cloud storage directory path to publish pipeline results to manually.
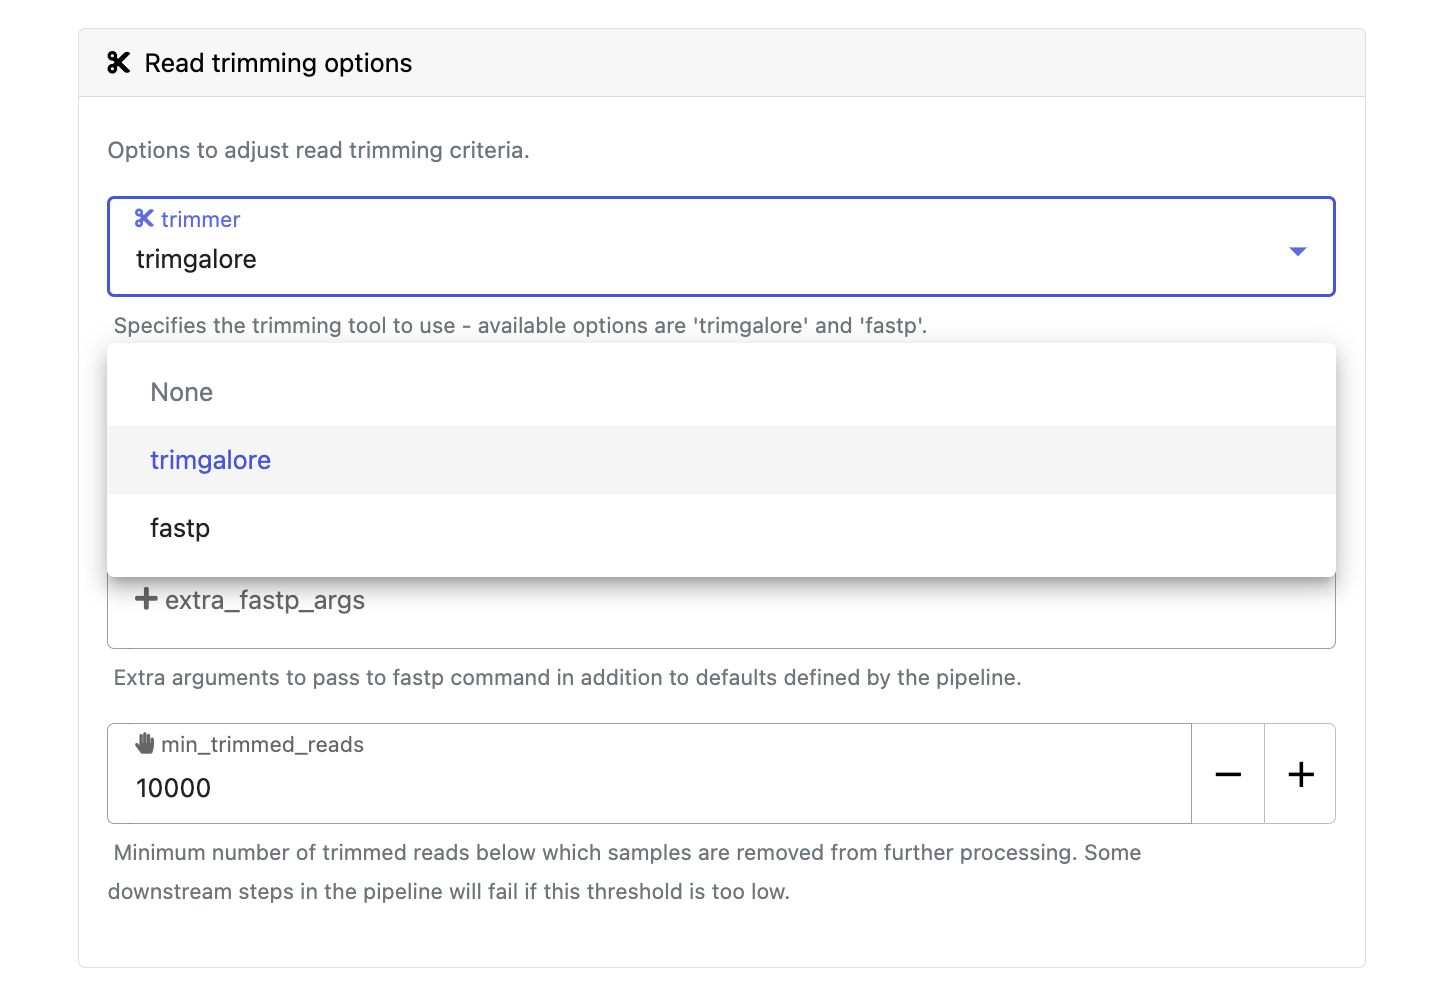
Pipeline-specific parameters
Modify other parameters to customize the pipeline execution through the parameters form. For example, under Read trimming options, change the trimmer to select fastp in the dropdown menu instead of trimgalore.
Select Launch to start the run and be directed to the Runs tab with your run in a submitted status at the top of the list.
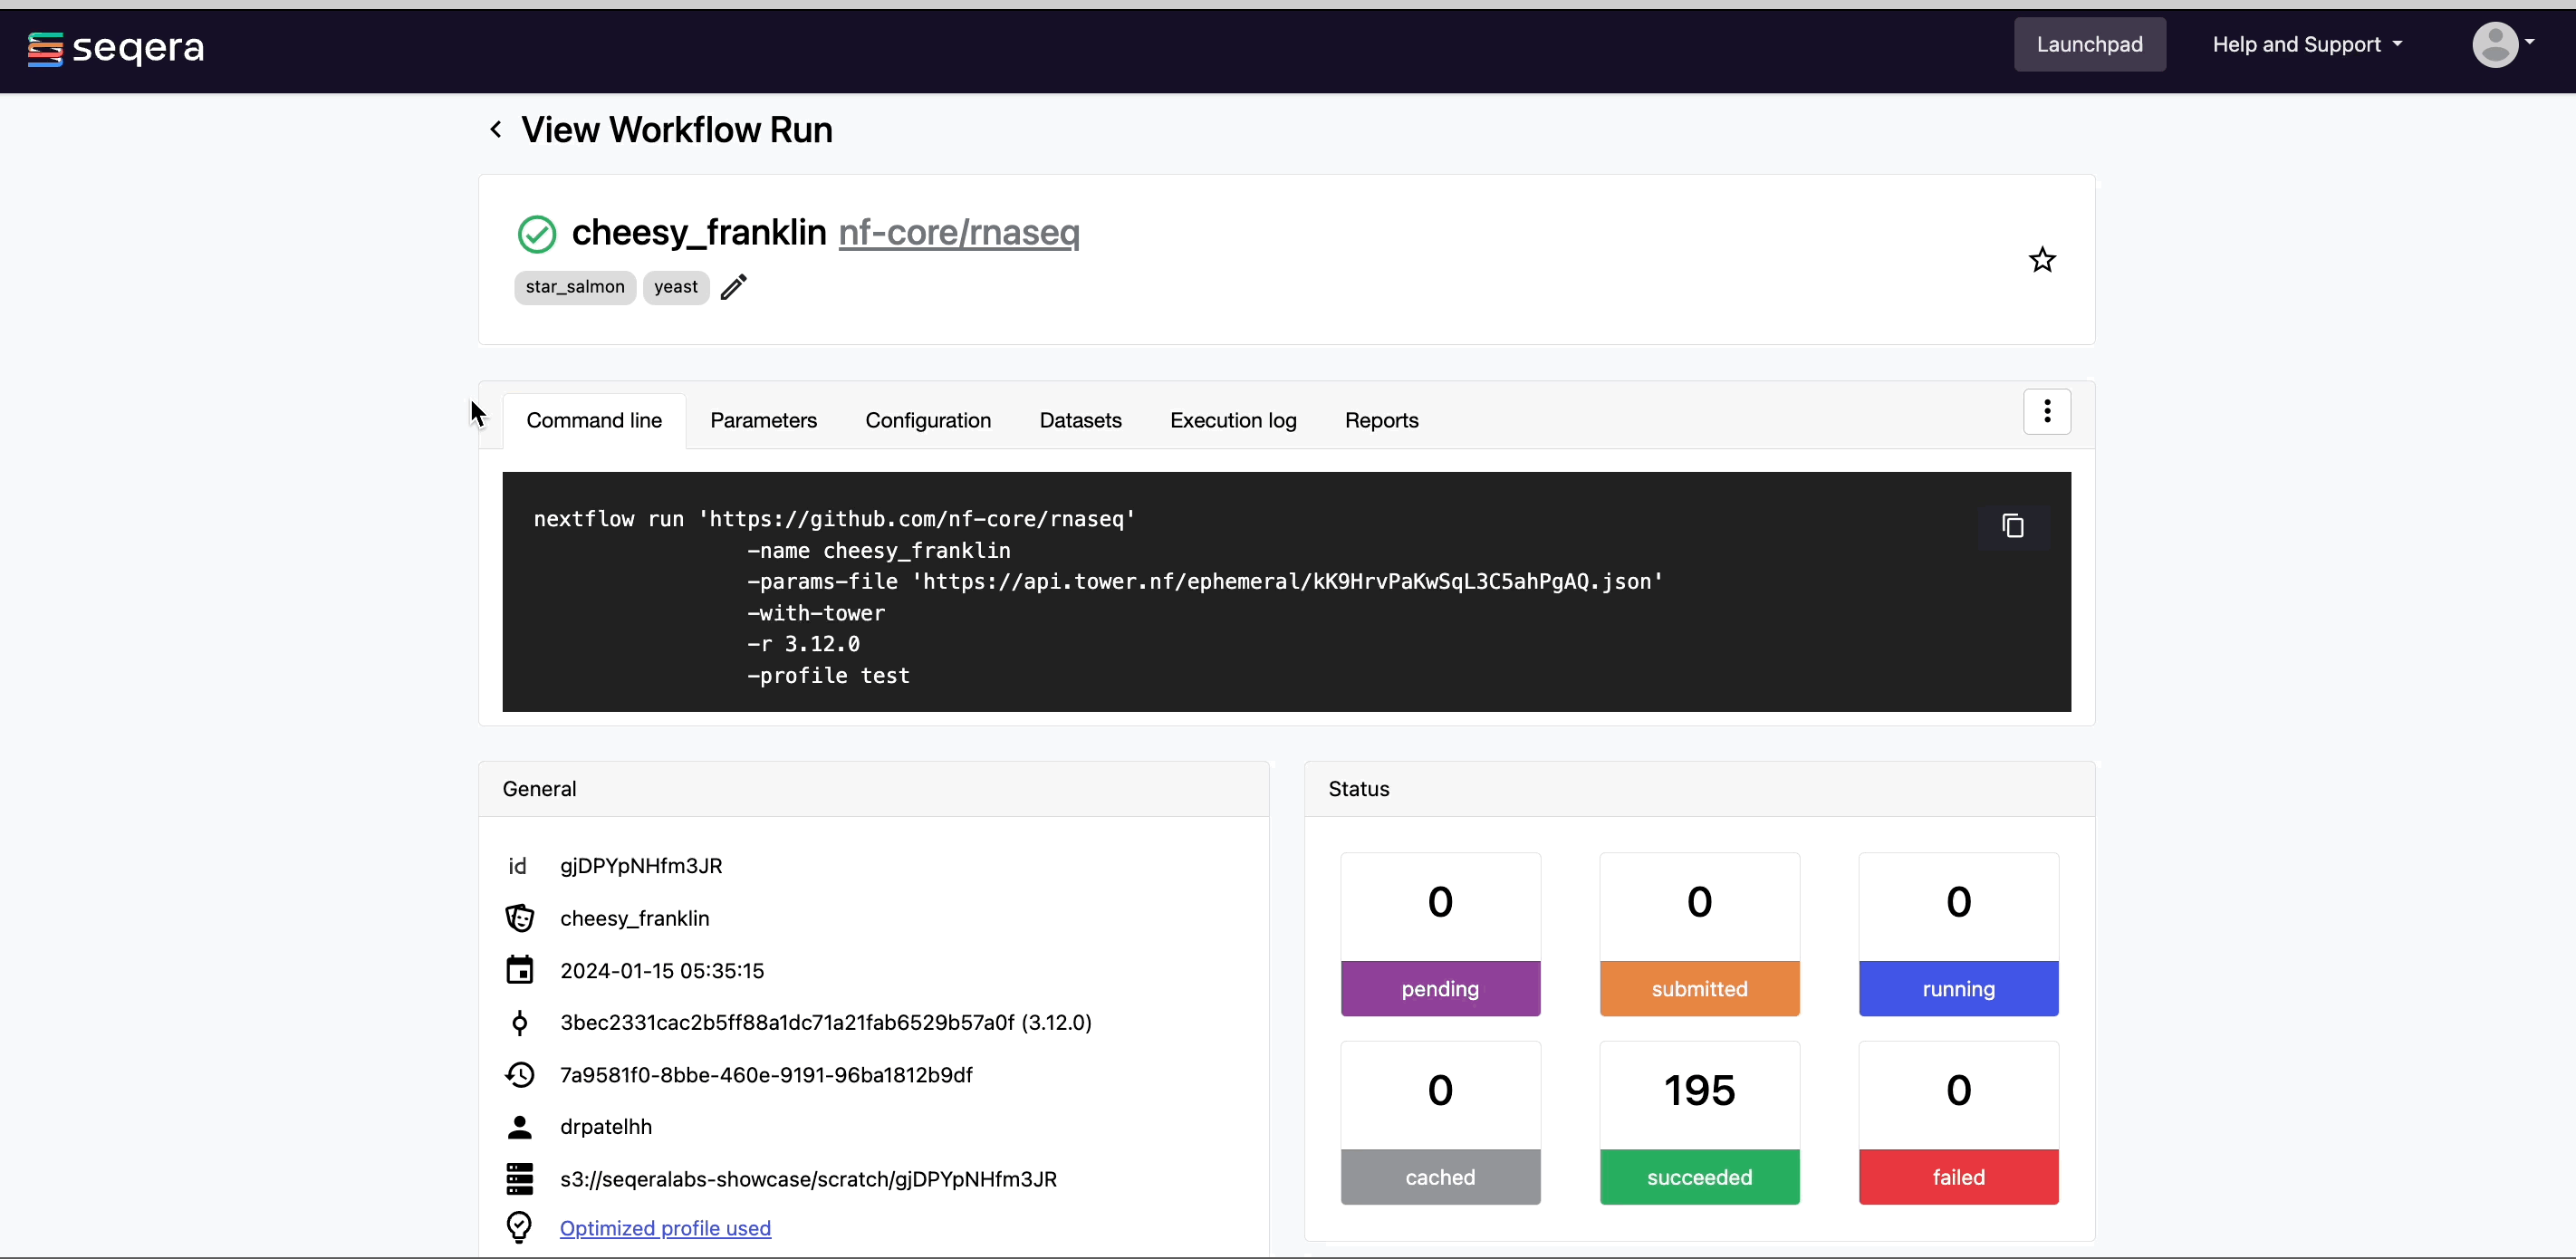
View run information
Run details page
As the pipeline runs, run details will populate with parameters, logs, and other important execution details:
View run details
- Command-line: The Nextflow command invocation used to run the pipeline. This contains details about the pipeline version (
-r 3.14.0flag) and profile, if specified (-profile testflag). - Parameters: The exact set of parameters used in the execution. This is helpful for reproducing the results of a previous run.
- Resolved Nextflow configuration: The full Nextflow configuration settings used for the run. This includes parameters, but also settings specific to task execution (such as memory, CPUs, and output directory).
- Execution Log: A summarized Nextflow log providing information about the pipeline and the status of the run.
- Datasets: Link to datasets, if any were used in the run.
- Reports: View pipeline outputs directly in the Platform.
View reports
Most Nextflow pipelines generate reports or output files which are useful to inspect at the end of the pipeline execution. Reports can contain quality control (QC) metrics that are important to assess the integrity of the results.
View run reports
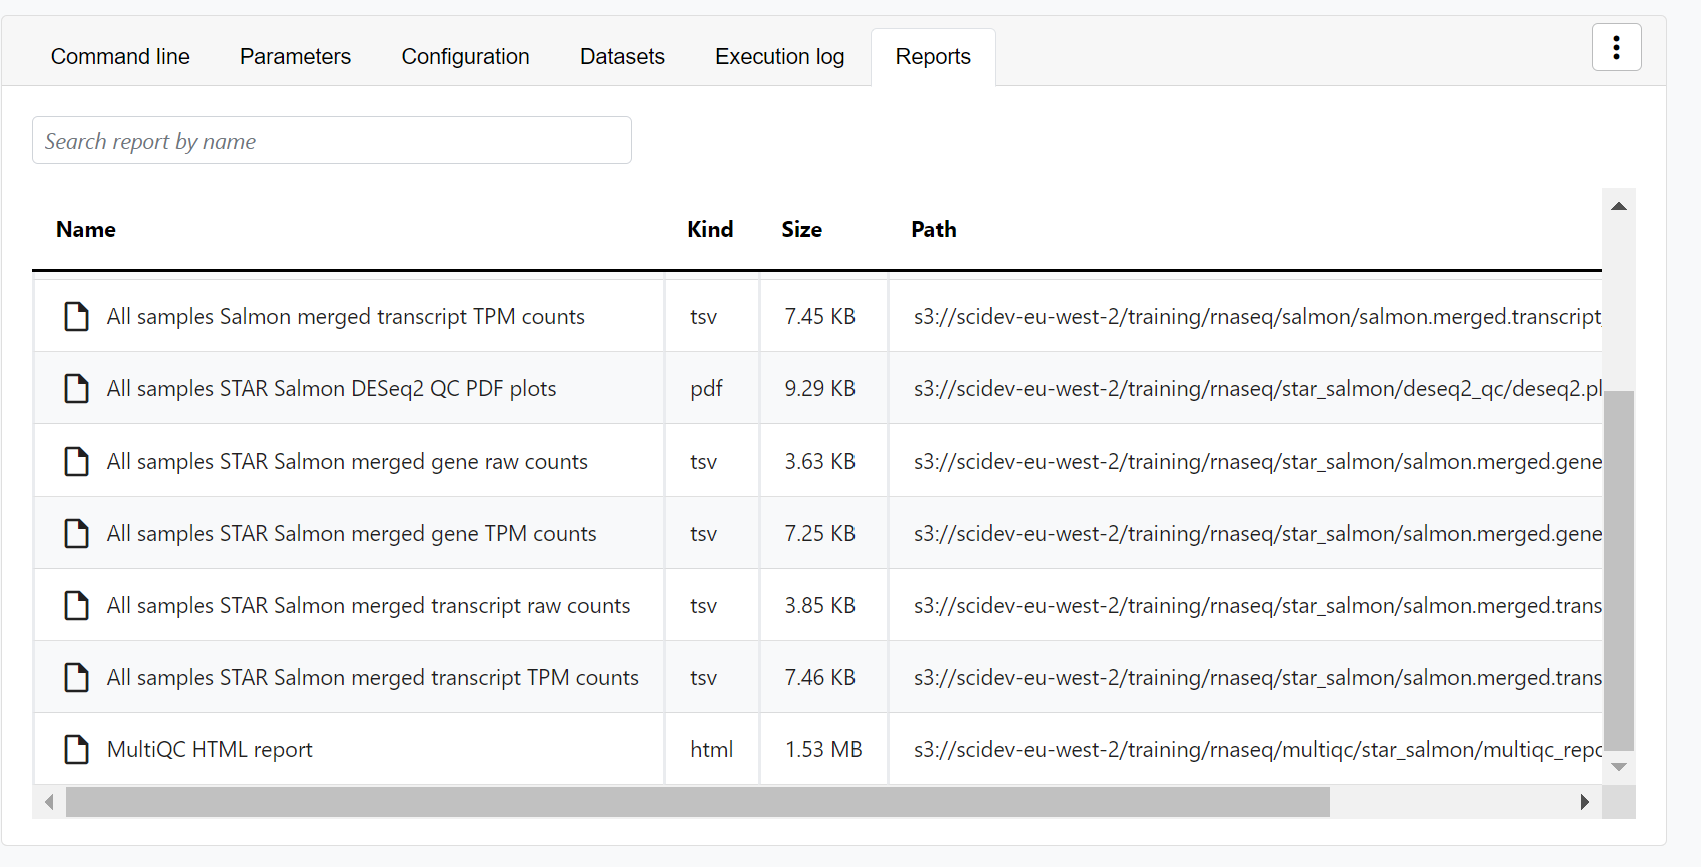
For example, for the nf-core/rnaseq pipeline, view the MultiQC report generated. MultiQC is a helpful reporting tool to generate aggregate statistics and summaries from bioinformatics tools.
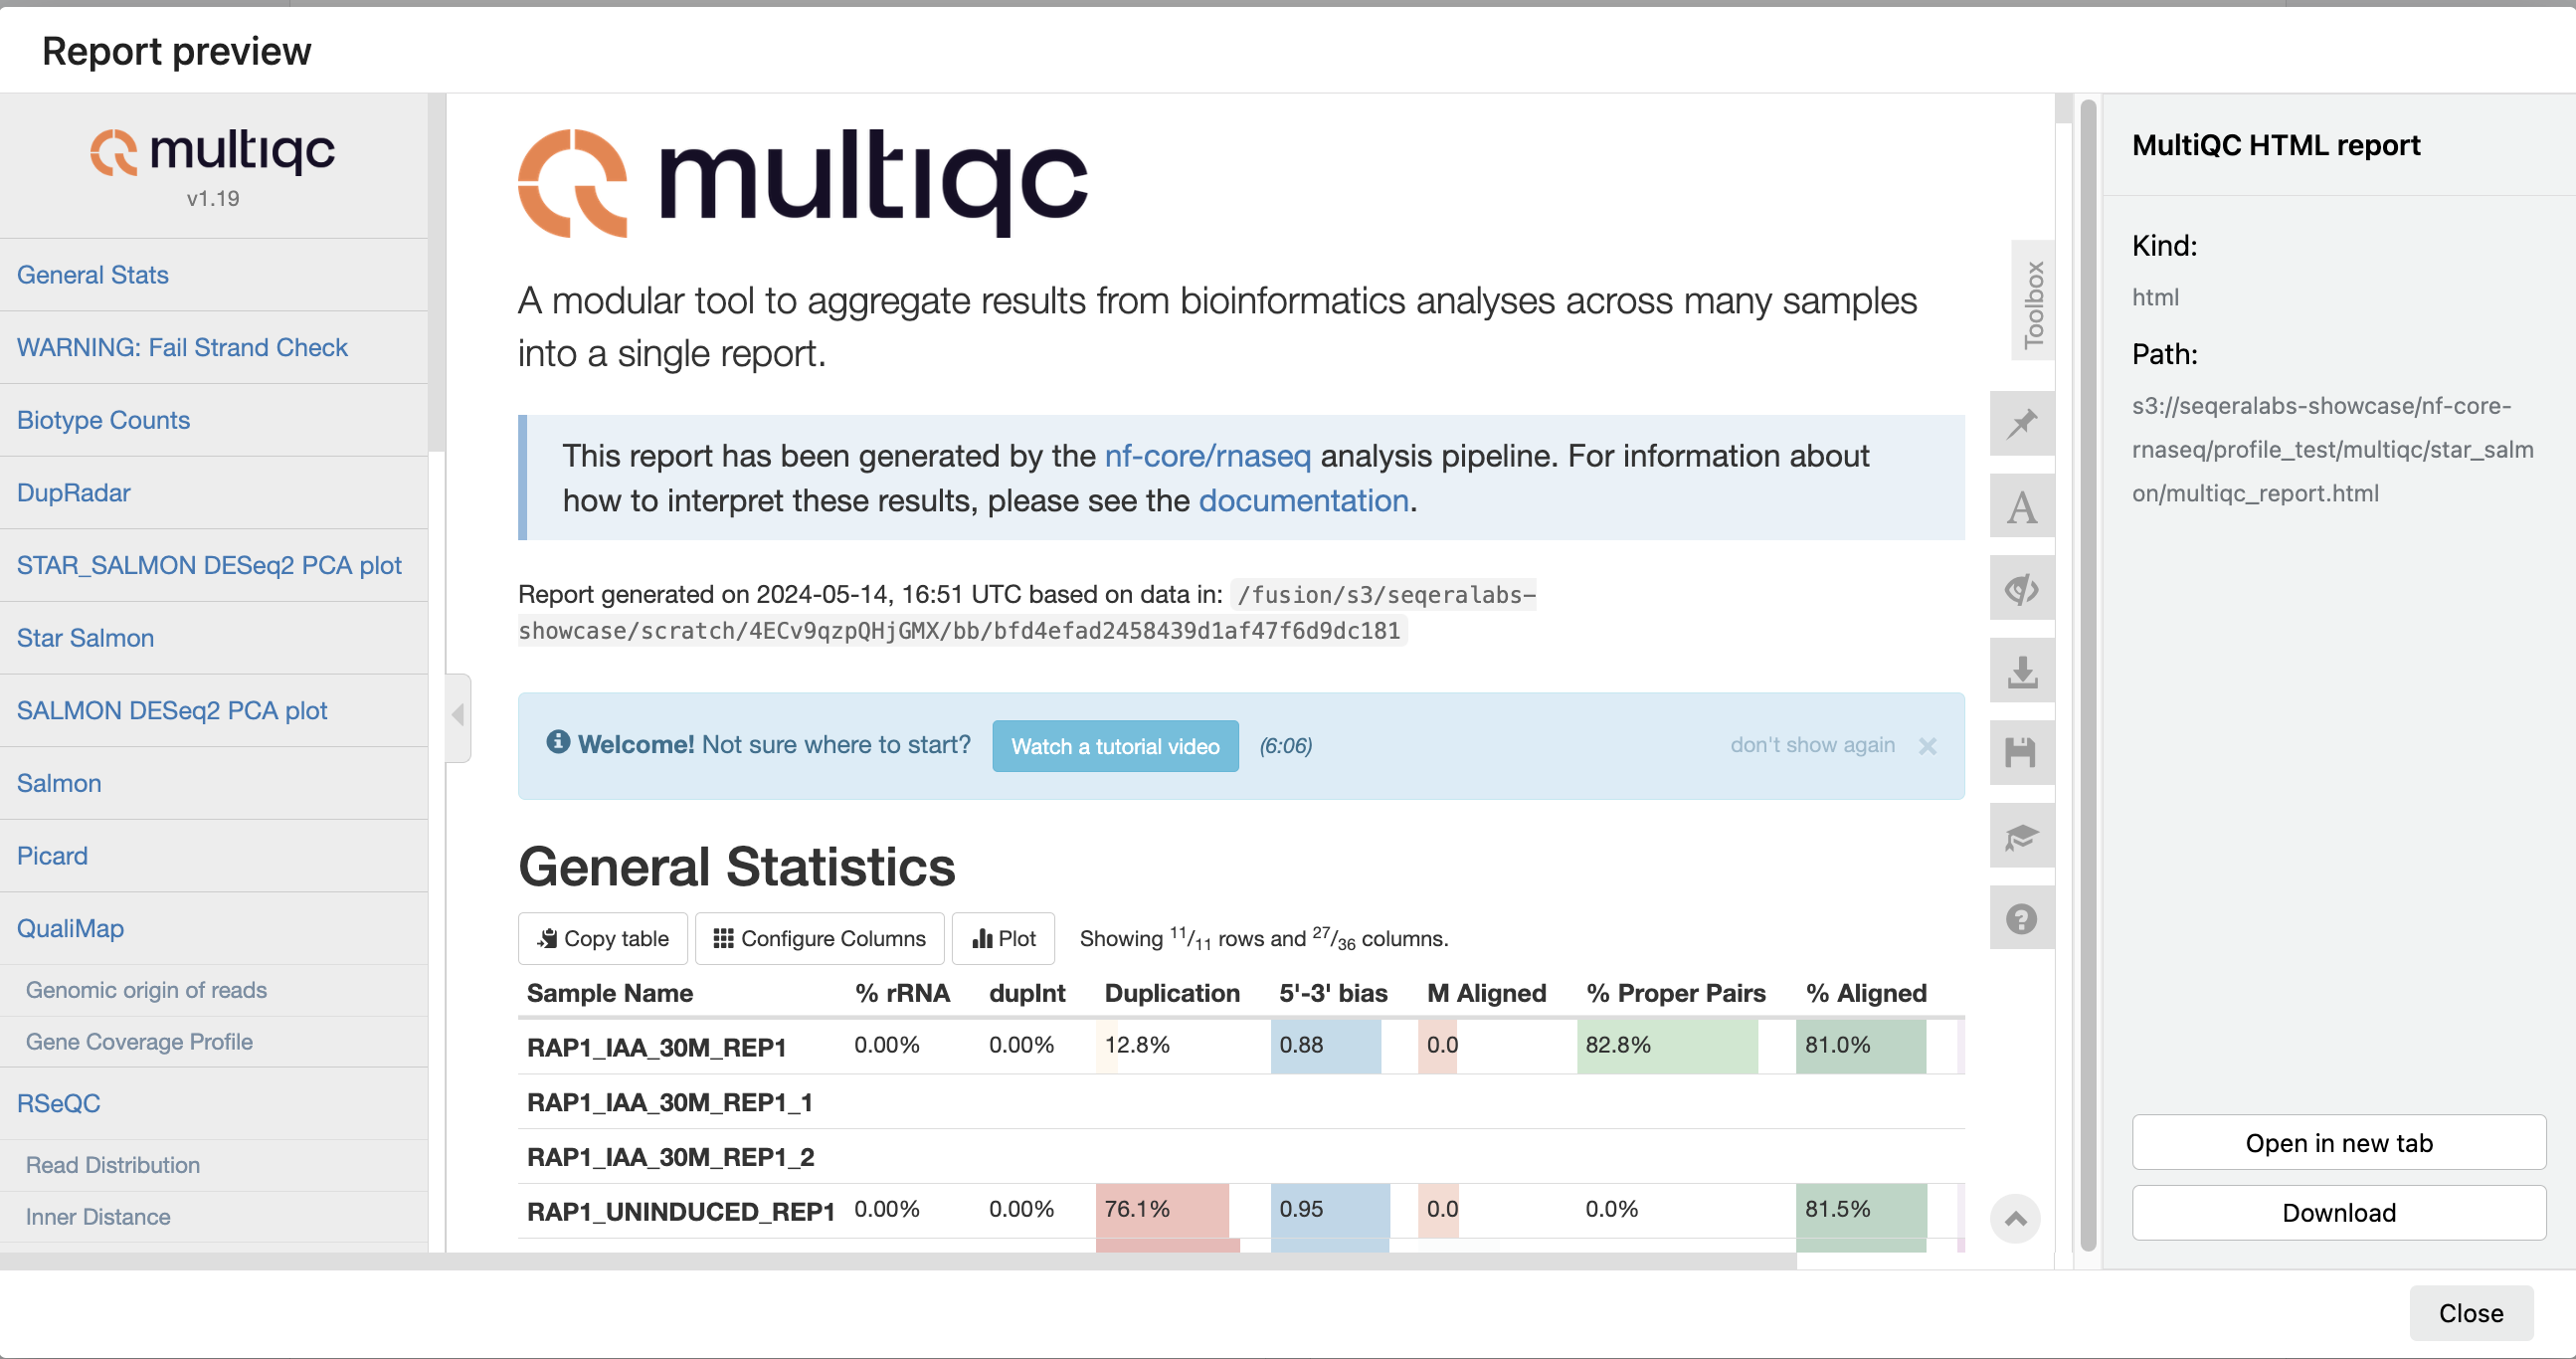
The paths to report files point to a location in cloud storage (in the outdir directory specified during launch), but you can view the contents directly and download each file without navigating to the cloud or a remote filesystem.
Specify outputs in reports
To customize and instruct Platform where to find reports generated by the pipeline, a tower.yml file that contains the locations of the generated reports must be included in the pipeline repository.
In the nf-core/rnaseq pipeline, the MULTIQC process step generates a MultiQC report file in HTML format:
reports:
  multiqc_report.html:
    display: "MultiQC HTML report"
See Reports to configure reports for pipeline runs in your own workspace.
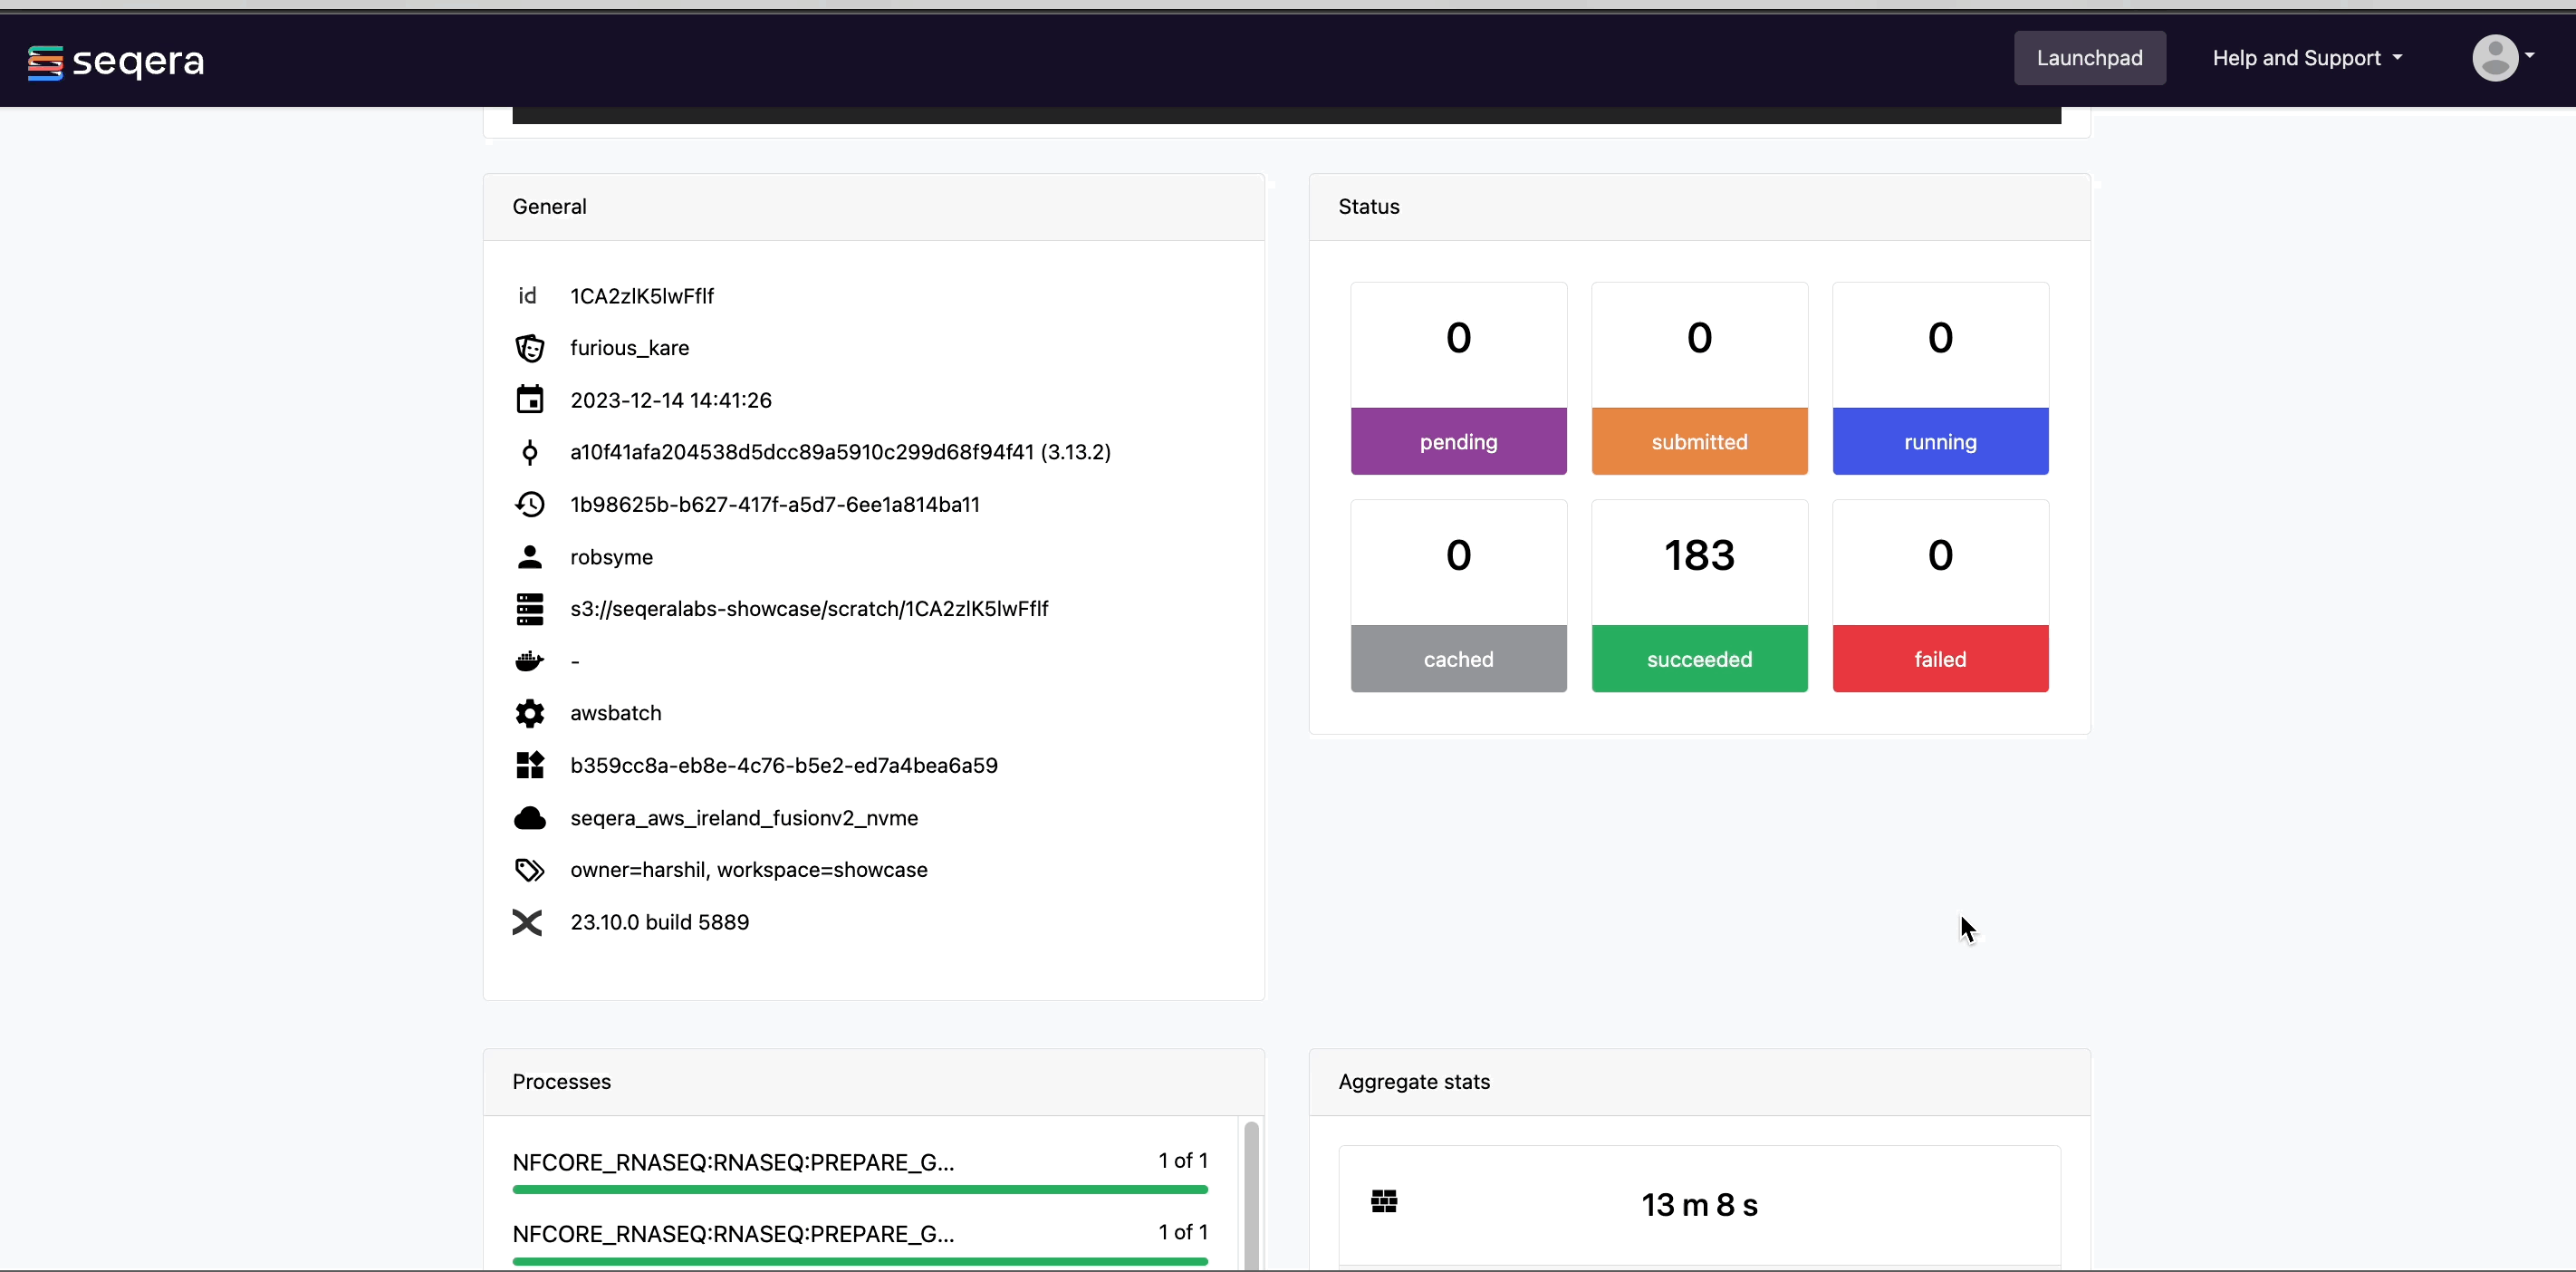
View general information
The run details page includes general information about who executed the run and when, the Git hash and tag used, and additional details about the compute environment and Nextflow version used.
View general run information
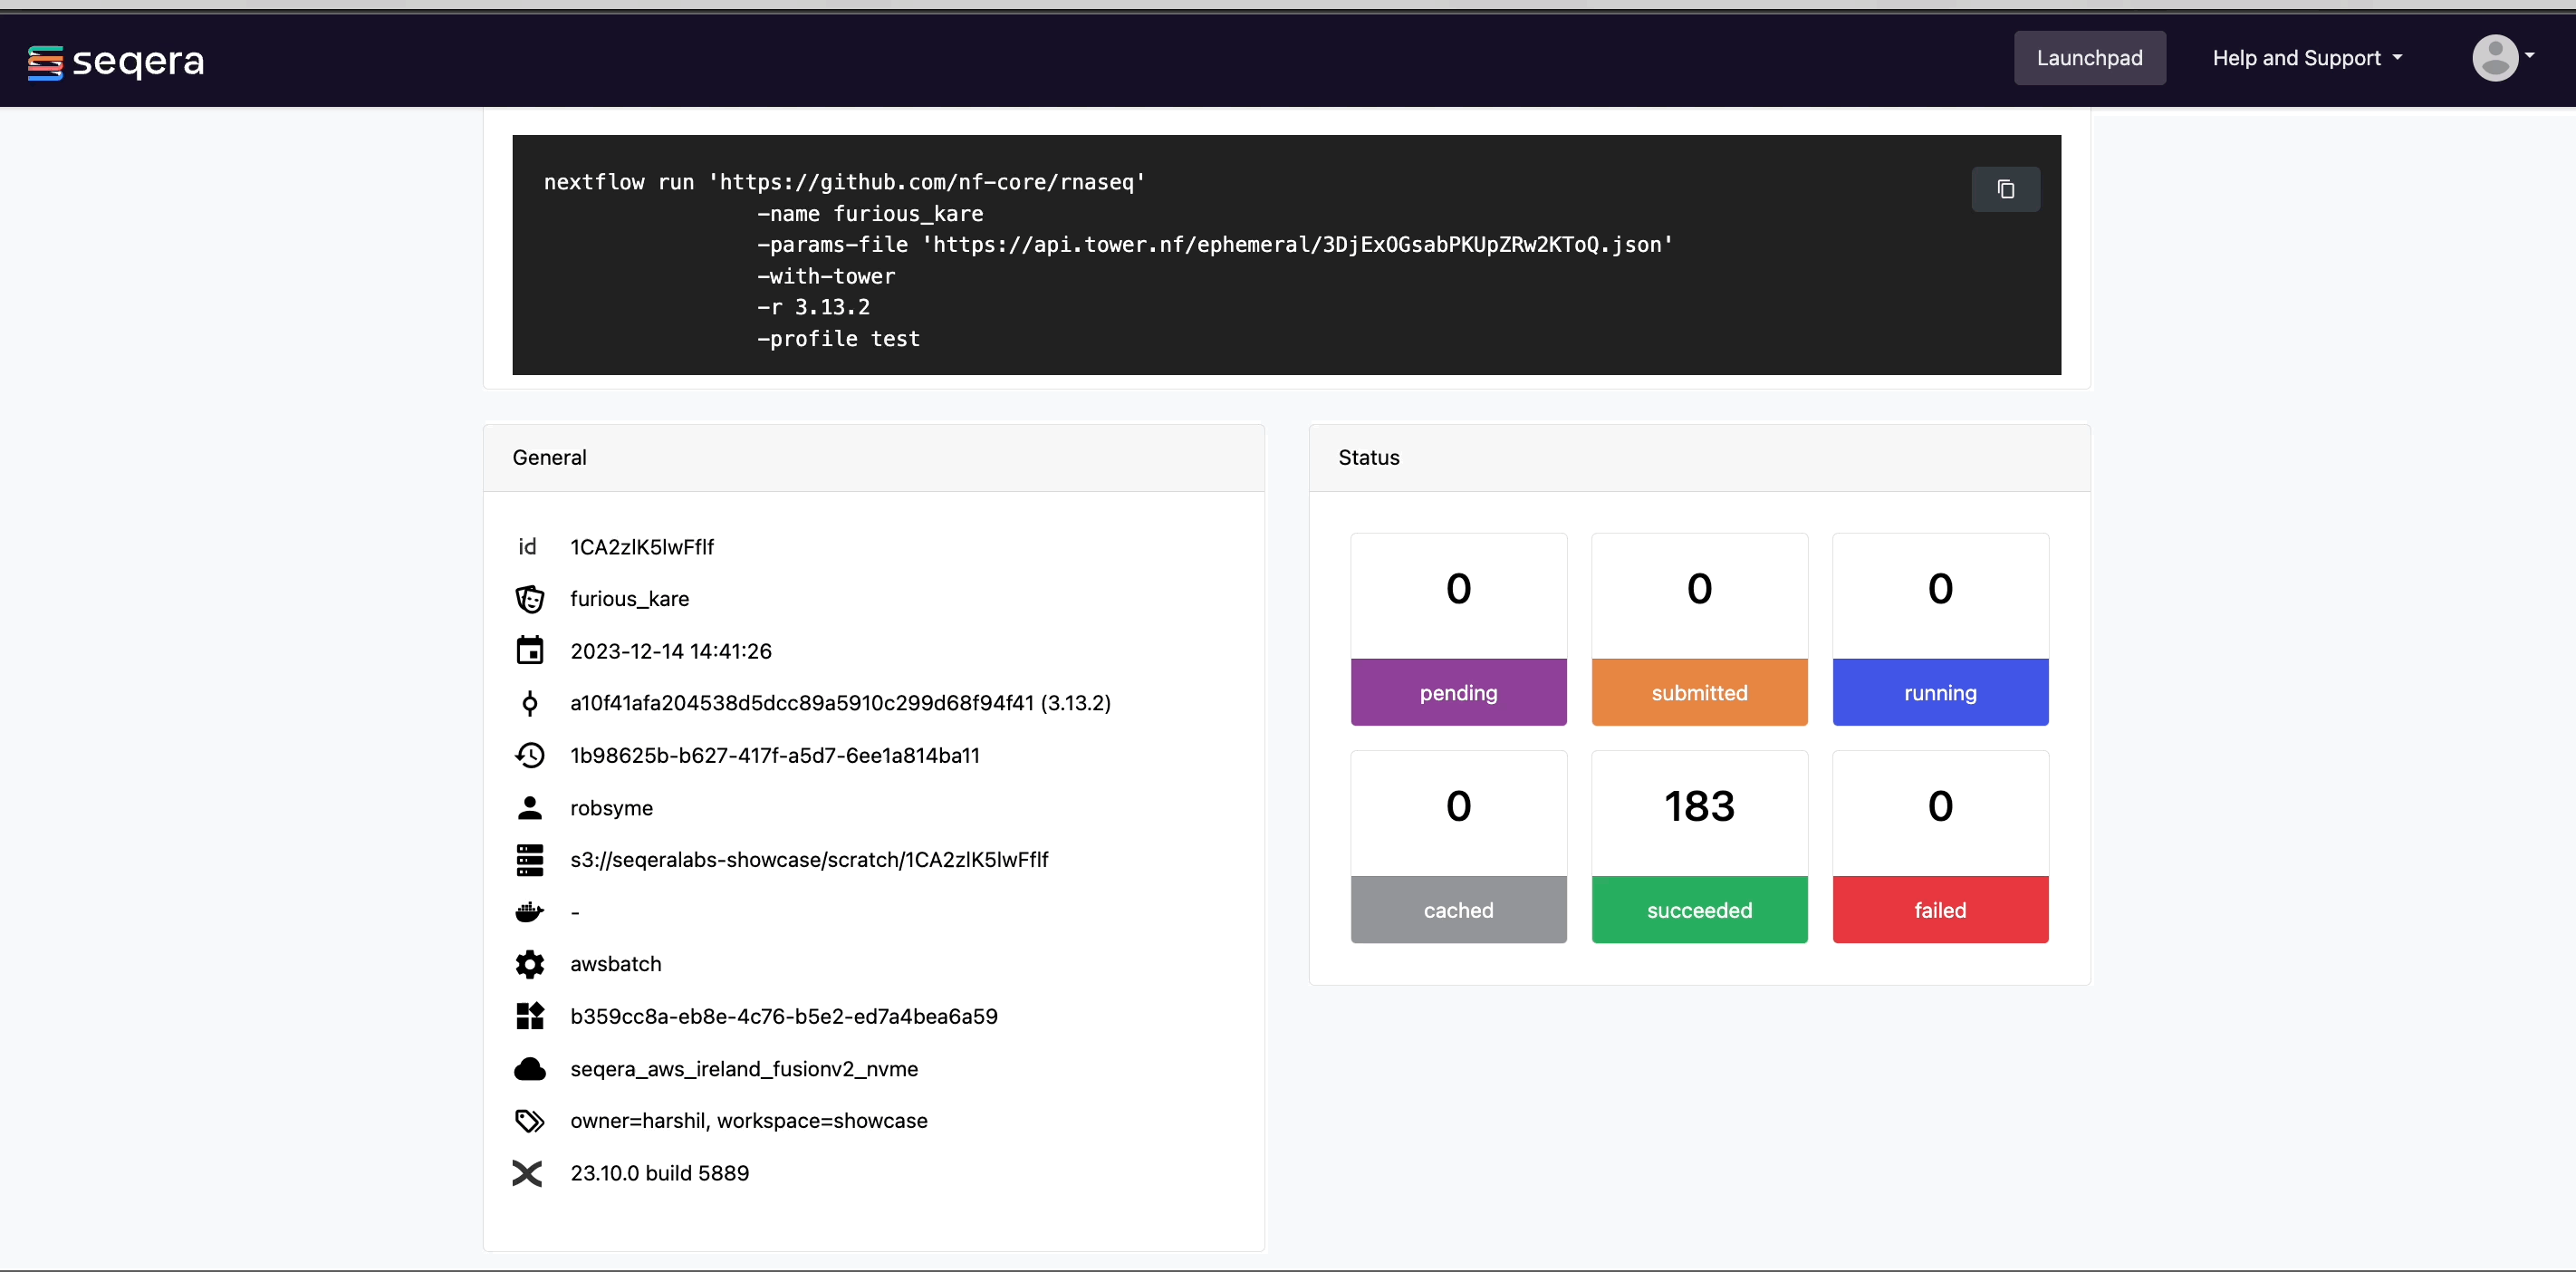
The General panel displays top-level information about a pipeline run:
- Unique workflow run ID
- Workflow run name
- Timestamp of pipeline start
- Pipeline version and Git commit ID
- Nextflow session ID
- Username of the launcher
- Work directory path
View process and task details
Scroll down the page to view:
- The progress of individual pipeline Processes
- Aggregated stats for the run (total walltime, CPU hours)
- Workflow metrics (CPU efficiency, memory efficiency)
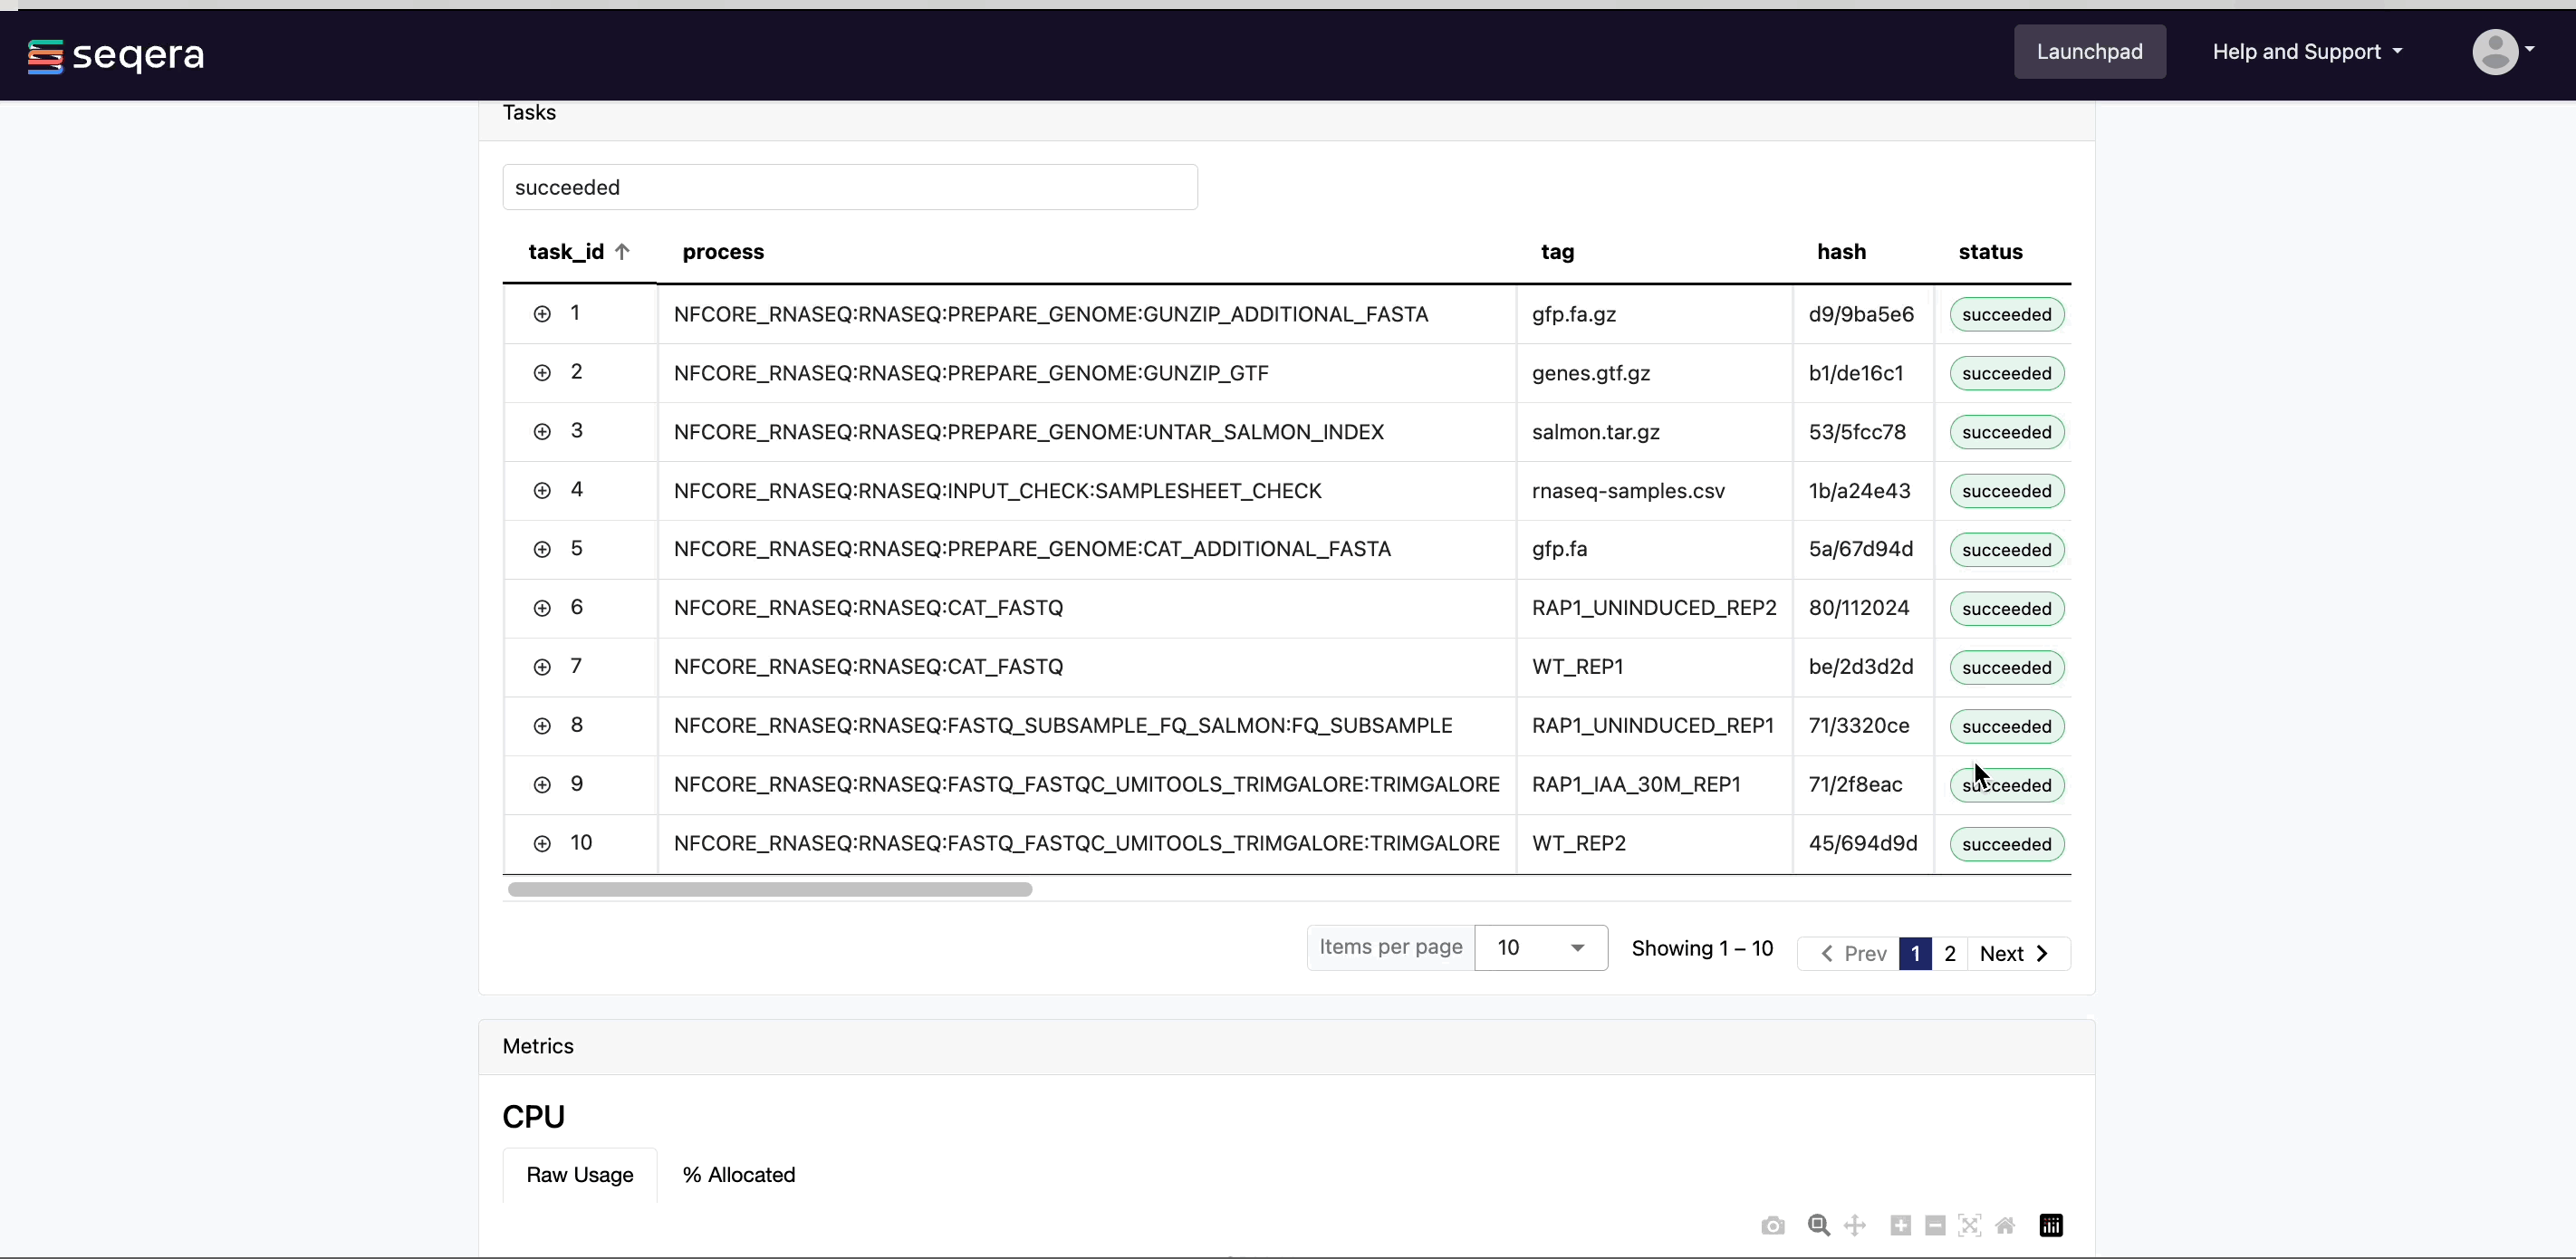
- A Task details table for every task in the workflow
The task details table provides further information on every step in the pipeline, including task statuses and metrics:
View task details
Select a task in the task table to open the Task details dialog. The dialog has three tabs: About, Execution log, and Data Explorer.
About
The About tab includes:
- Name: Process name and tag
- Command: Task script, defined in the pipeline process
- Status: Exit code, task status, and number of attempts
- Work directory: Directory where the task was executed
- Environment: Environment variables that were supplied to the task
- Execution time: Metrics for task submission, start, and completion time
- Resources requested: Metrics for the resources requested by the task
- Resources used: Metrics for the resources used by the task
Execution log
The Execution log tab provides a real-time log of the selected task's execution. Task execution and other logs (such as stdout and stderr) are available for download from here, if still available in your compute environment.
Task work directory in Data Explorer
If a task fails, a good place to begin troubleshooting is the task's work directory. Nextflow hash-addresses each task of the pipeline and creates unique directories based on these hashes.
View task log and output files
Instead of navigating through a bucket on the cloud console or filesystem, use the Data Explorer tab in the Task window to view the work directory.
Data Explorer allows you to view the log files and output files generated for each task, directly within Platform. You can view, download, and retrieve the link for these intermediate files to simplify troubleshooting.
Tertiary analysis
Tertiary analysis of pipeline results is often performed in platforms like Jupyter Notebook or RStudio. Setting up the infrastructure for these platforms, including accessing pipeline data and the necessary bioinformatics packages, can be complex and time-consuming.
Data Studios streamlines the process of creating interactive analysis environments for Platform users. With built-in templates, creating a data studio is as simple as adding and sharing pipelines or datasets.
Analyze RNAseq data in Data Studios
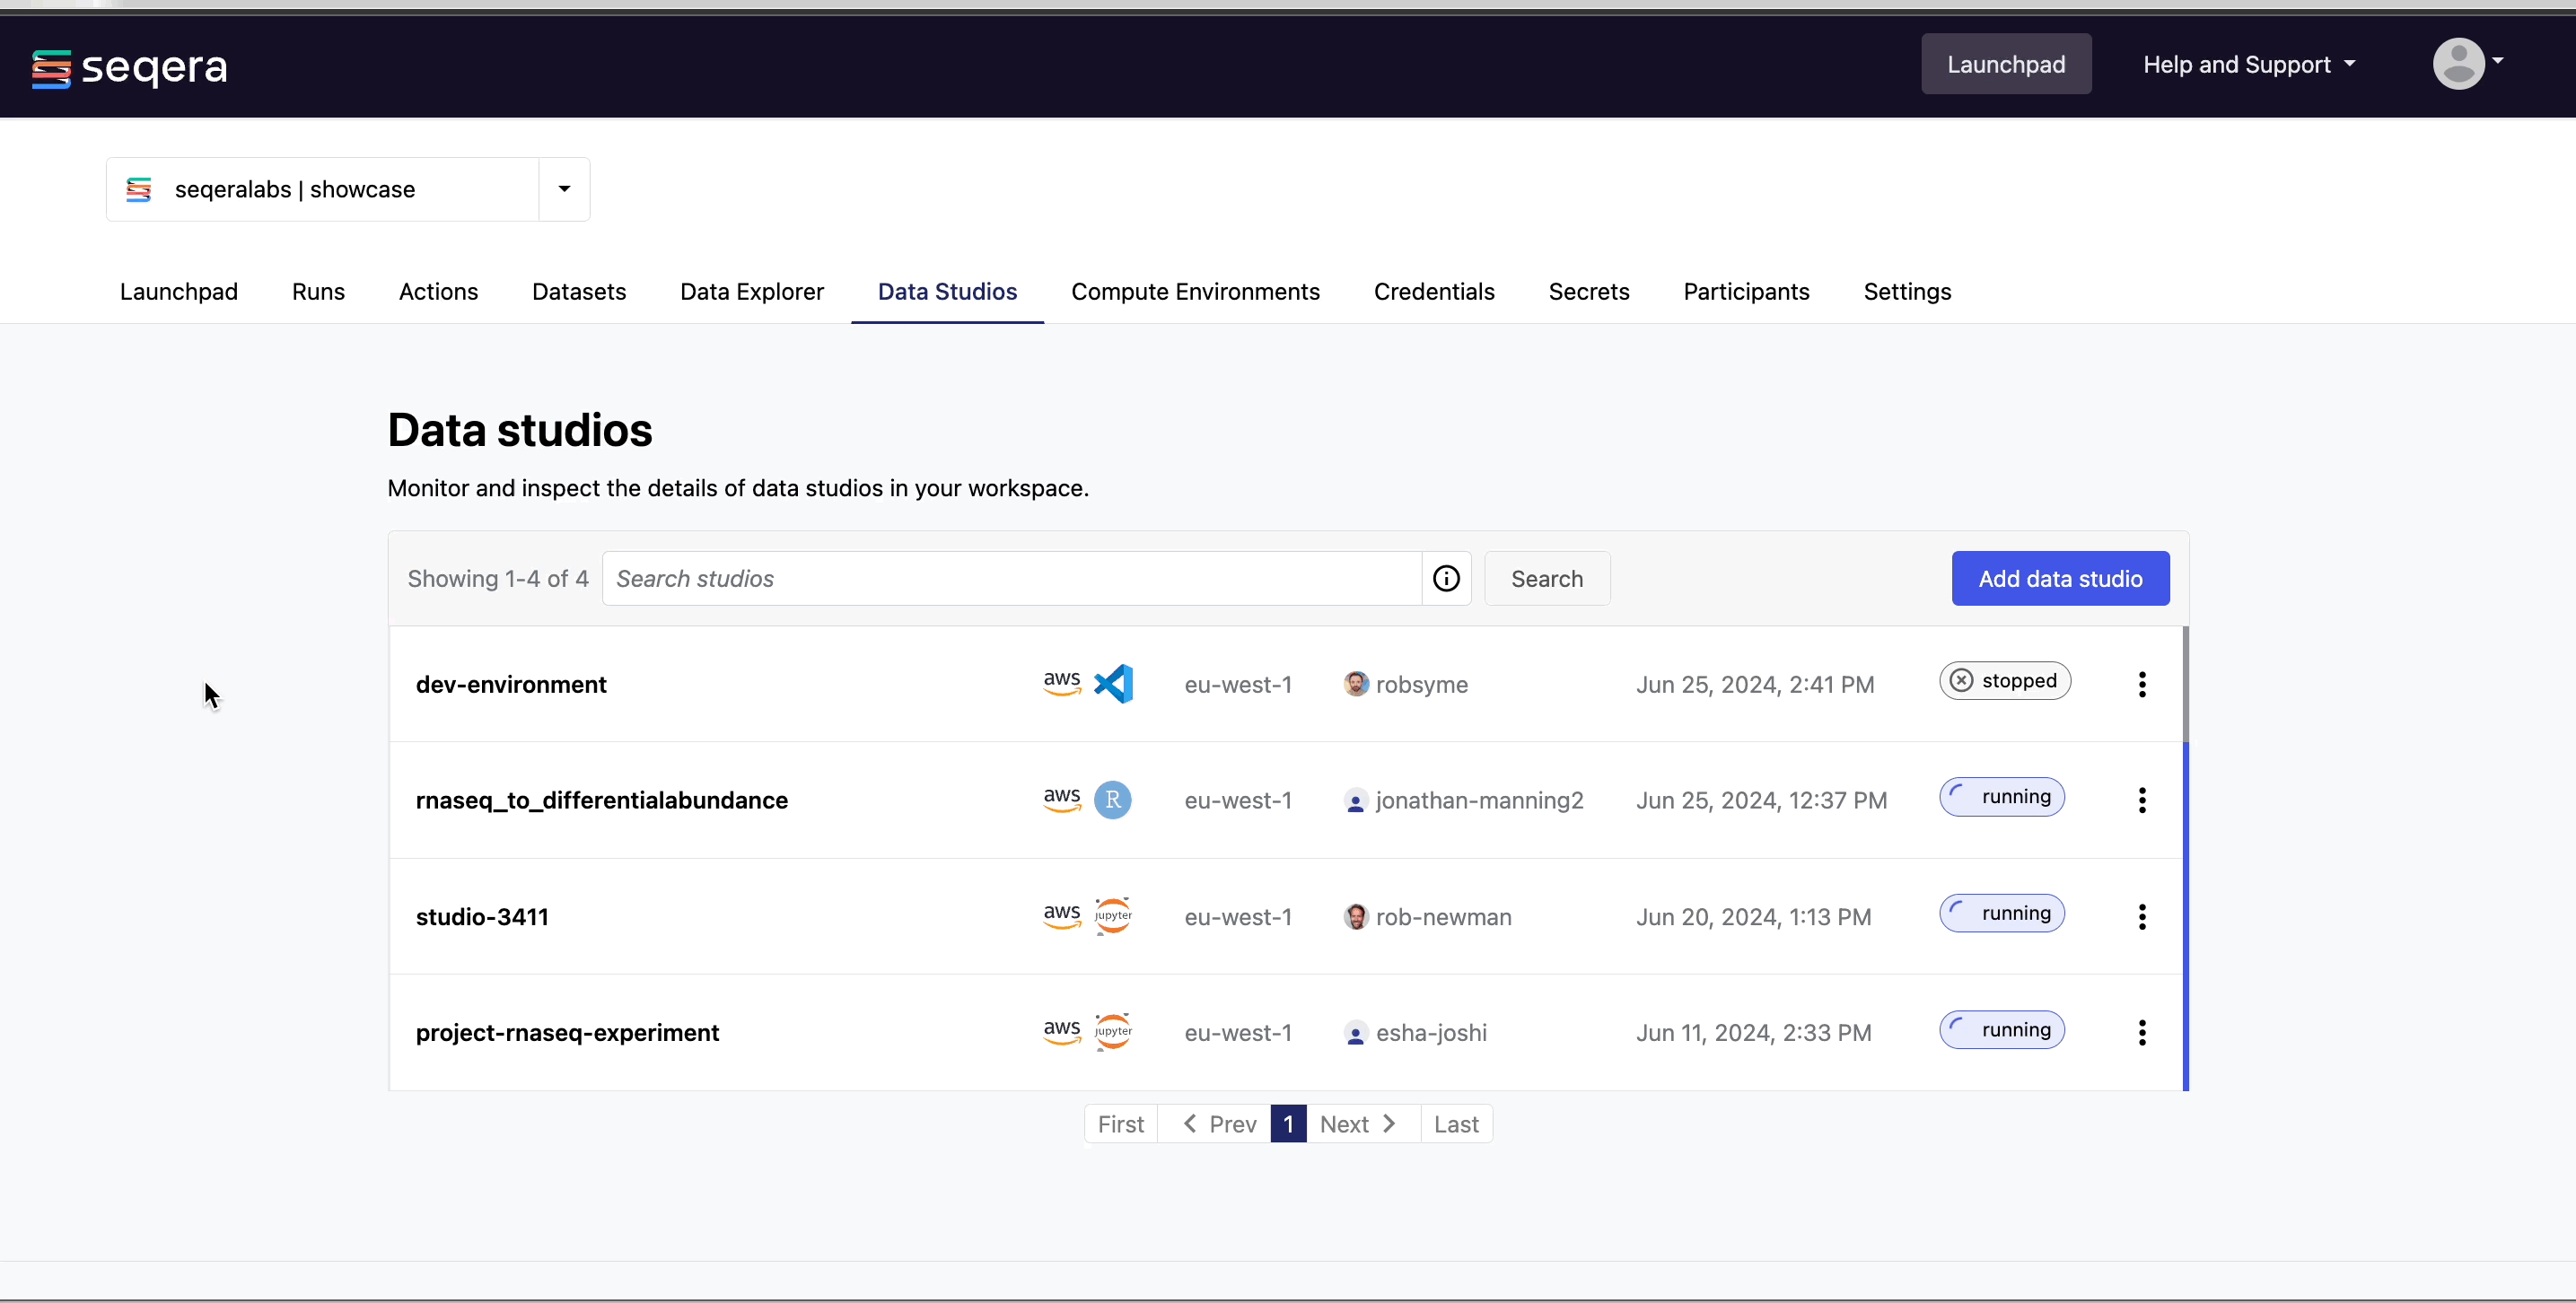
In the Data Studios tab, you can monitor and see the details of the data studios in the Community Showcase workspace.
Data Studios is used to perform bespoke analysis on the results of upstream workflows. For example, in the Community Showcase workspace we have run the nf-core/rnaseq pipeline to quantify gene expression, followed by nf-core/differentialabundance to derive differential expression statistics. The workspace contains a data studio with these results from cloud storage mounted into the studio to perform further analysis. One of these outputs is an RShiny application, which can be deployed for interactive analysis.
Connect to the RNAseq analysis studio
Select the rnaseq_to_differentialabundance data studio. This studio consists of an RStudio environment that uses an existing compute environment available in the showcase workspace. The studio also contains mounted data generated from the nf-core/rnaseq and subsequent nf-core/differentialabundance pipeline runs, directly from AWS S3.
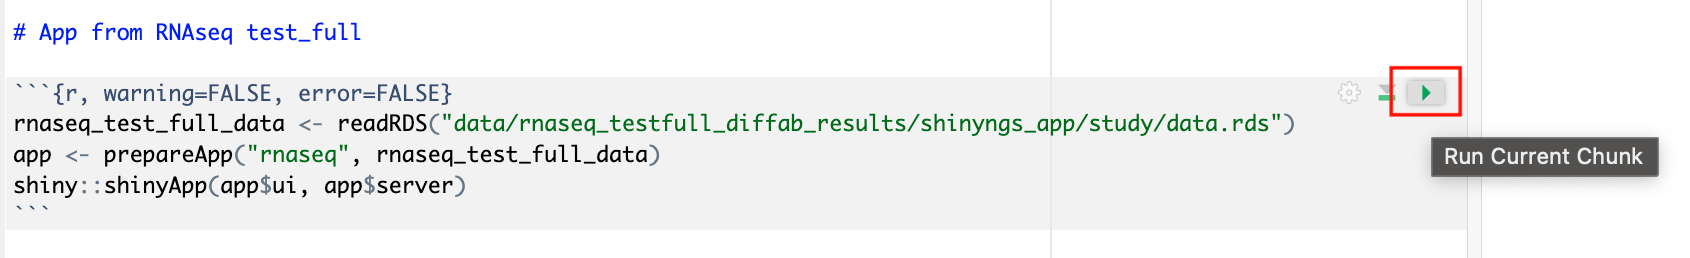
Select Connect to view the running RStudio environment. The rnaseq_to_differentialabundance studio includes the necessary R packages for deploying an RShiny application to visualize the RNAseq data.
Deploy the RShiny app in the data studio by selecting the green play button on the last chunk of the R script:
Data Studios allows you to specify the resources each studio will use. When creating your own data studios with shared compute environment resources, you must allocate sufficient resources to the compute environment to prevent data studio or pipeline run interruptions.
Explore results
The RShiny app will deploy in a separate browser window, providing a data interface. Here you can view information about your sample data, perform QC or exploratory analysis, and view the results of differential expression analyses.
Sample clustering with PCA plots
In the QC/Exploratory tab, select the PCA (Principal Component Analysis) plot to visualize how the samples group together based on their gene expression profiles.
In this example, we used RNA sequencing data from the publicly-available ENCODE project, which includes samples from four different cell lines:
- GM12878 — a lymphoblastoid cell line
- K562 — a chronic myelogenous leukemia cell line
- MCF-7 — a breast cancer cell line
- H1-hESC — human embryonic stem cells
What to look for in the PCA plot:
- Replicate clustering: Ideally, biological replicates of the same cell type should cluster closely together. For example, replicates of MCF-7 (breast cancer cell line) group together. This indicates consistent gene expression profiles among biological replicates.
- Cell type separation: Different cell types should form distinct clusters. For instance, GM12878, K562, MCF-7, and H1-hESC samples should each form their own separate clusters, reflecting their unique gene expression patterns.
From this PCA plot, you can gain insights into the consistency and quality of your sequencing data, identify any potential issues, and understand the major sources of variation among your samples - all directly in Platform.
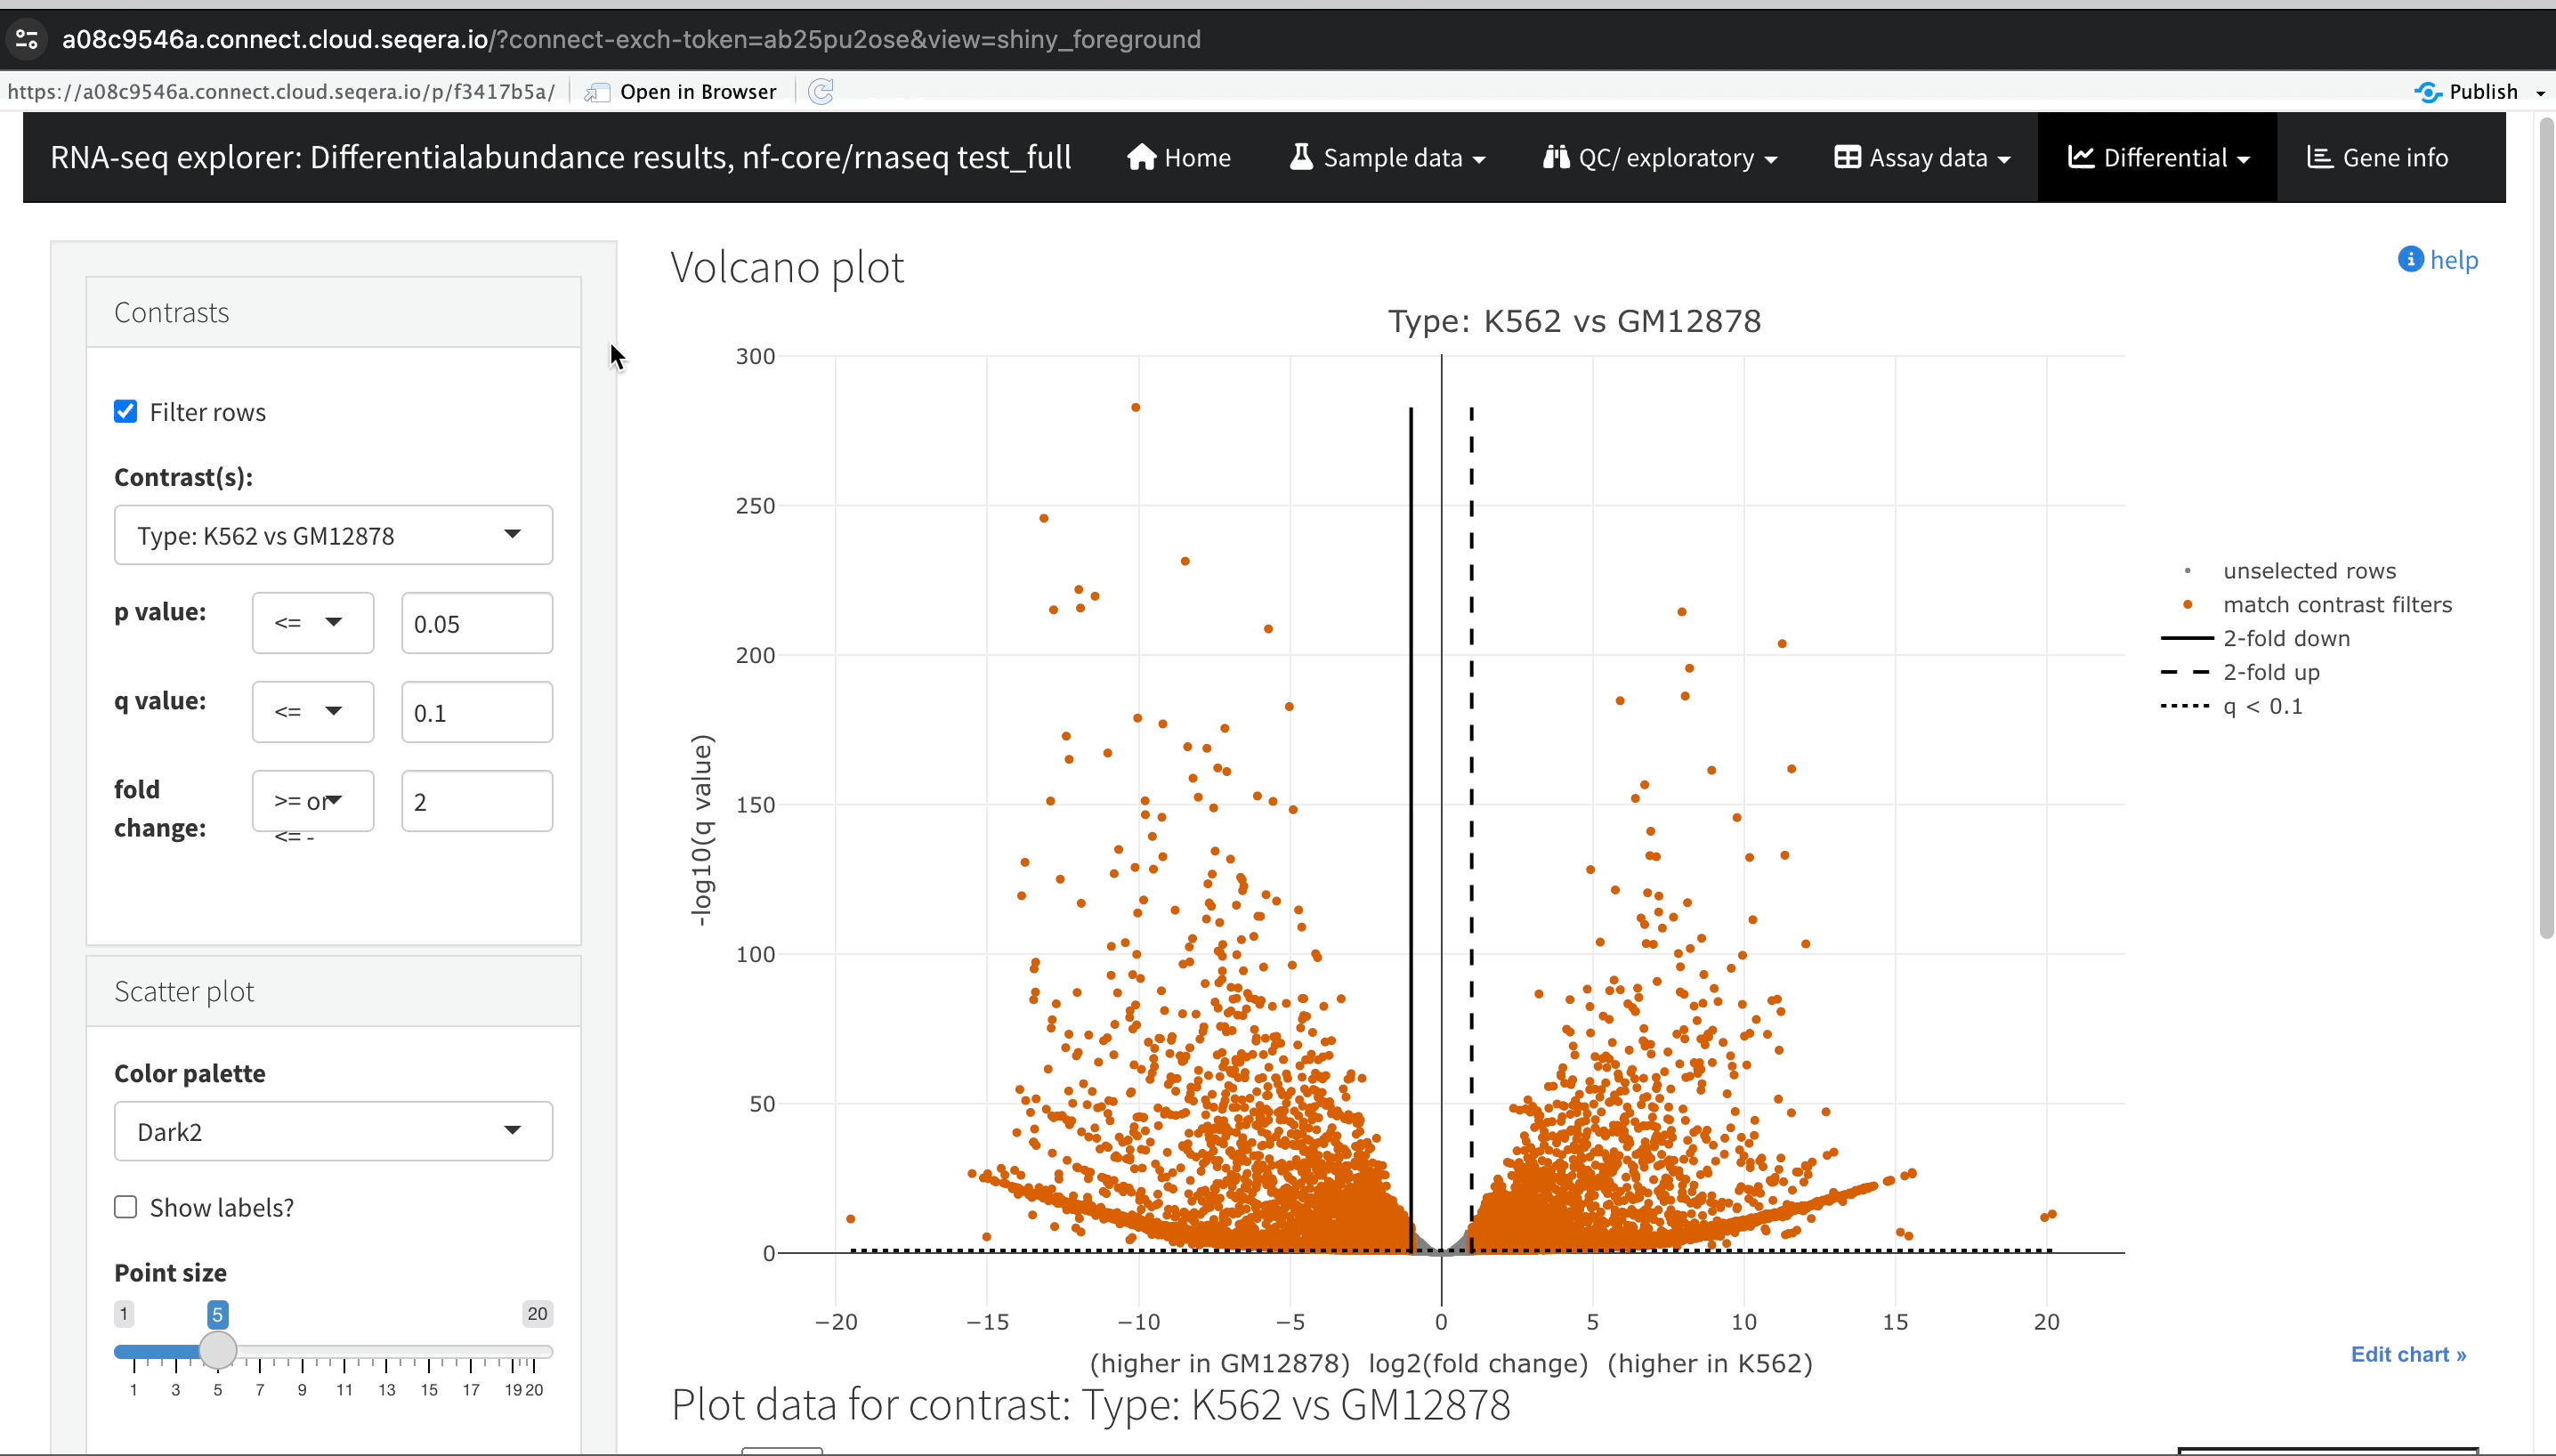
Gene expression changes with Volcano plots
In the Differential tab, select Volcano plots to compare genes with significant changes in expression between two samples. For example, filter for Type: H1 vs MCF-7 to view the differences in expression between these two cell lines.
-
Identify upregulated and downregulated genes: The x-axis of the volcano plot represents the log2 fold change in gene expression between the H1 and MCF-7 samples, while the y-axis represents the statistical significance of the changes.
- Upregulated genes in MCF-7: Genes on the left side of the plot (negative fold change) are upregulated in the MCF-7 samples compared to H1. For example, the SHH gene, which is known to be upregulated in cancer cell lines, prominently appears here.
-
Filtering for specific genes: If you are interested in specific genes, use the filter function. For example, filter for the SHH gene in the table below the plot. This allows you to quickly locate and examine this gene in more detail.
-
Gene expression bar plot: After filtering for the SHH gene, select it to navigate to a gene expression bar plot. This plot will show you the expression levels of SHH across all samples, allowing you to see in which samples it is most highly expressed.
- Here, SHH is most highly expressed in MCF-7, which aligns with its known role in cancer cell proliferation.
Using the volcano plot, you can effectively identify and explore the genes with the most significant changes in expression between your samples, providing a deeper understanding of the molecular differences.
Collaborate in the data studio
To share the results of your RNAseq analysis or allow colleagues to perform exploratory analysis, share a link to the data studio by selecting the options menu for the data studio you want to share, then select Copy data studio URL. With this link, other authenticated users with the Connect role (or greater) can access the session directly.
See Data Studios to learn how to create data studios in your own workspace.
Pipeline optimization
Seqera Platform's task-level resource usage metrics allow you to determine the resources requested for a task and what was actually used. This information helps you fine-tune your configuration more accurately.
However, manually adjusting resources for every task in your pipeline is impractical. Instead, you can leverage the pipeline optimization feature available on the Launchpad.
Pipeline optimization analyzes resource usage data from previous runs to optimize the resource allocation for future runs. After a successful run, optimization becomes available, indicated by the lightbulb icon next to the pipeline turning black.
Optimize nf-core/rnaseq
Navigate back to the Launchpad and select the lightbulb icon next to the nf-core/rnaseq pipeline to view the optimized profile. You have the flexibility to tailor the optimization's target settings and incorporate a retry strategy as needed.
View optimized configuration
When you select the lightbulb, you can access an optimized configuration profile in the second tab of the Customize optimization profile window.
This profile consists of Nextflow configuration settings for each process and each resource directive (where applicable): cpus, memory, and time. The optimized setting for a given process and resource directive is based on the maximum use of that resource across all tasks in that process.
Once optimization is selected, subsequent runs of that pipeline will inherit the optimized configuration profile, indicated by the black lightbulb icon with a checkmark.
Optimization profiles are generated from one run at a time, defaulting to the most recent run, and not an aggregation of previous runs.
Verify the optimized configuration of a given run by inspecting the resource usage plots for that run and these fields in the run's task table:
| Description | Key |
|---|---|
| CPU usage | pcpu |
| Memory usage | peakRss |
| Runtime | start and complete |